Showing posts with label rheology. Show all posts

Monday, November 16, 2020

Texture analysis by DiRDiP

Imagine you have a set of points evolving in time. It can be the center of colloidal particles in a suspension, of cell nuclei in a tissue, of bubbles in a foam, of people in a crowd. You also have a way of defining which point is bonded to which one. Two people are bonded if they hold hands. Two nuclei are bonded if their respective cell membranes touch. Two bubbles are bonded if they share a soap film. Two colloidal particles are bonded if they are within a certain distance from each other.

And now you make this dynamical, with people moving and handshaking around, bubbles deforming to flow through a funnel, colloidal suspension beeing sheared, tissue trying to fix the scar of a scalpel cut. Your points are moving and your bonds can stretch, rotate, break or be born.

A set of 9 positions with bonds between them, evolving in time. The positions can move, the bonds can appear (green) or disappear (red).

How would you characterize this mess? How to make statistically significant observations of such an ensemble of discreet events? How to deduce anything about the response properties of your system? 

One way is to translate the original discreet description of the evolution of the system (discreet points moving and discreet bonds deforming, appearing or disappearing) into a continuous description in terms of strain field. Even better, in terms of strain fields: the reversible part of the strain that correspond to the bonds that deform without breaking on one hand, and on the other hand the irreversible part of the strain that corresponds to the bonds that appear or disappear.

I've just released a piece of code that does just that.

It's based on a great method published by François Graner and Benjamin Dollet in 2008 that allow to go from the set of point to the mechanical properties of the system. This paper is great, pedestrian and extremely clear on every detail. I really recommend the read if you know a bit about strain tensors and continuous mechanics.

Unfortunately, the original implementation of this analysis in Delphi was lost and later implementations in Matlab were never brought to releasable form. That is why I reimplemented everything in Python - I hope in a clean enough way - so that others will be tempted to use this method. 

This new implementation relies only on Numpy and Numba for optimized calculations, and on Matplotlib to display the results. 
 
I've cooked up examples to show how to use Trackpy results stored in Pandas dataframes as positions and how scipy.spatial can be used to define bonds.
 
Following the title of the original paper, the code is named DiRDiP, for Discrete Rearranging Disordered Patterns.
 
The code can be cited using the DOI provided by Zenodo: 
Mathieu Leocmach, DiRDiP, https://doi.org/10.5281/zenodo.4276047 (2020)


What the code takes as input

  • Two arrays of coordinates at two different times. The dimensionality is arbitray, but for most applications 2D and 3D will be enough.
  • Two sets of bonds, each linking positions at one of the two times.
  • A grid on which to compute the continuous description. I've implemented the rectilinear grid in any dimension, the regular grid in any dimension, and the polar grid in 2D. Implementing other grids (spherical, cylindrical, etc) would be rather easy.

What the code outputs

Arrays of matrices, one matrix per grid element. Exemple of matrices (as defined in the paper):
  • statistical velocity gradient
  • statistical rotation rate
  • statistical topological rearrangement rate

There is a submodule dedicated to displaying such arrays of matrices in Matplotlib.

What the code does not do

  • Localize interesting points and link their positions in time. Use Trackpy for that, or what fits to your problem.
  • Decide which points are linked together. This dependes so much on the physics or biology of your system. Some possible geometrical criteria are implemented in scipy.spatial, like Voronoi neighbourhood, k-nearest neighbours, distance criterion, etc.
  • Decide how to average the results to obtain statistical significance. But you know, averaging numpy arrays is pretty easy. For example, if you have a seady state, you may want to average in time the arrays resulting from two successive time steps. If you have a spatial symmetry or invariance in your system, you may want to exploit it.

What I am proud of

  • Unit tests
  • Documentation of each function
  • Some examples

What it still lack to be perfect

  • A tutorial
  • A generated documentation 
  • More users

Sunday, April 27, 2014

Testing rupture models

How do materials break ? This question is the starting point of my present post-doc in France. People have good ideas on how metals and crystals break, because their structures are known for a century or two. But when you turn your attention to more messy materials, like composites, concrete, paper, gels, etc. the answers are far less convincing.


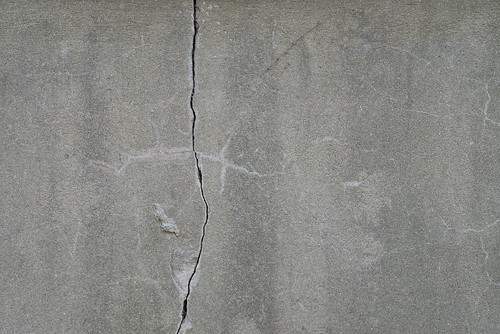
concrete 8

Popular (because simple) models of fractures are called fibre bundle models. Imagine a cotton yarn, or a rope made of many interlocked fibres. If you pull on it hard enough and for long enough, a fibre will break. The pulling strength will be shared by all the other fibres, until an other one breaks. The more broken fibres, the less remaining fibres, the more often a new fibre breaks. Sounds like a random action movie scene, isn't it?


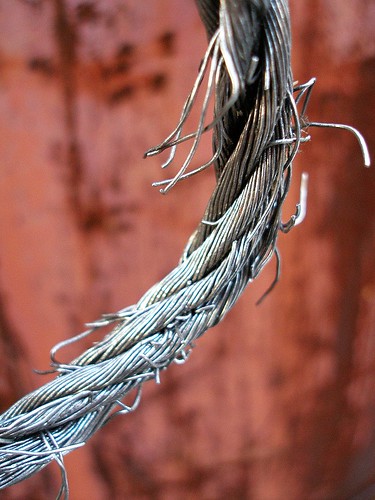
Breaking wire rope

A first simple model is to consider that the fibres are independent from each other and each of them has a slightly different breaking threshold. The only way fibres interact with each other is by sharing evenly the load. This model is good at describing how paper breaks. It predicts that over a given load threshold, the material will always break. The stronger you pull, the faster it breaks, conversely if you pull just a minute amount above the threshold it will take a very long time to break. For most of the process, you may even not notice that you are damaging your rope. That's why in the movies it's always when the last guy crossing the rope bridge who falls.


A mode refined version of the model says that when a fibre breaks, the load it bear is split among its neighbouring fibres. It makes sense when you consider an actual rope, made of smaller twines, made of even smaller threads, etc. until you get to the individual fibres. What this new model predicts is the absence of threshold load. If you pull on your material long enough, it will break, whatever your strength. Of course, the weaker you are, the longer you'll have to wait. An other interesting prediction is the appearance of fractures, or regions where all the fibres are broken. Can this explain the fractures and cracks observed in many materials? That's on this question that I started my own research.


I selected a system that indeed looks like a network of fibres:

Casein gel seen by Transmission Electron Microscopy from Kaláb 1983
This is a gel obtained by slow acidification of a solution of milk protein (sodium caseinate), or in plain English: a yoghurt. The picture above was made by electron microscopy, and the white fibres you see are one hundred time thinner that a human hair. The black voids are occupied my water that flows throughout the network.


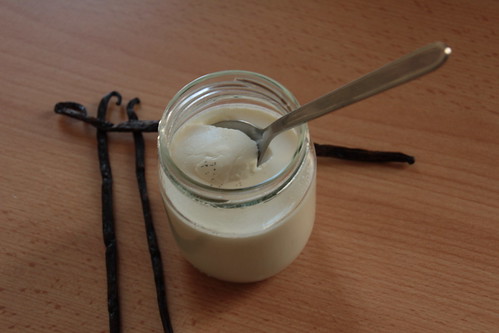
Unstirred yoghurt do behave very much like a hard solid, except that it is much weaker. You don't need a powerful machine to fracture it, a spoon is enough.

Yaourt à la vanille

And once it is broken, the cracks won't heal. It is very different from a liquid or from pastes that you can stir to erase the memory of the system. If you stir a yoghurt you just destroy it further.


Sketch of a Couette cell an visualisation of the fractures

Now, I don't trust myself to apply a constant force with a spoon, especially if the experiment is set to run for a week. So I make my yoghurt between two concentric cylinders of a machine called a rheometer, which is able to rotate the inner cylinder with a constant force until the next power cut. Step by step: I pour the protein solution in the rheometer at rest, the gel forms during 17 hours as the solution acidifies, and only then I apply the force.


As you see on the picture above, after some time fractures appear in the yoghurt and grow vertically. By the way, the picture was taken by a standard webcam. This is not rocket science. The picture above shows only the bottom half of the yoghurt, there are fracture also growing from the top. When bottom and top fracture meet, the gel breaks completely.


I repeated this experiment many times, varying the applied load and thus the time needed to break the yoghurt completely. At high load, I am limited by the recording frequency of the rheometer, so my minimal breaking time is slightly less that a second. On low load, patience is the limiting factor, as well as evaporation and mold growth. Still I have an experiment that lasted 11 days. That is a factor 10 million between the longest and shortest experiments, enough to prove that there is no meaningful load threshold. That is a first win for the model.


Edit March 29th, 2014

A video of the rupture. Nothing seems to append and then ...