Showing posts with label My stuff. Show all posts

Monday, November 16, 2020

Texture analysis by DiRDiP

Imagine you have a set of points evolving in time. It can be the center of colloidal particles in a suspension, of cell nuclei in a tissue, of bubbles in a foam, of people in a crowd. You also have a way of defining which point is bonded to which one. Two people are bonded if they hold hands. Two nuclei are bonded if their respective cell membranes touch. Two bubbles are bonded if they share a soap film. Two colloidal particles are bonded if they are within a certain distance from each other.

And now you make this dynamical, with people moving and handshaking around, bubbles deforming to flow through a funnel, colloidal suspension beeing sheared, tissue trying to fix the scar of a scalpel cut. Your points are moving and your bonds can stretch, rotate, break or be born.

A set of 9 positions with bonds between them, evolving in time. The positions can move, the bonds can appear (green) or disappear (red).

How would you characterize this mess? How to make statistically significant observations of such an ensemble of discreet events? How to deduce anything about the response properties of your system? 

One way is to translate the original discreet description of the evolution of the system (discreet points moving and discreet bonds deforming, appearing or disappearing) into a continuous description in terms of strain field. Even better, in terms of strain fields: the reversible part of the strain that correspond to the bonds that deform without breaking on one hand, and on the other hand the irreversible part of the strain that corresponds to the bonds that appear or disappear.

I've just released a piece of code that does just that.

It's based on a great method published by François Graner and Benjamin Dollet in 2008 that allow to go from the set of point to the mechanical properties of the system. This paper is great, pedestrian and extremely clear on every detail. I really recommend the read if you know a bit about strain tensors and continuous mechanics.

Unfortunately, the original implementation of this analysis in Delphi was lost and later implementations in Matlab were never brought to releasable form. That is why I reimplemented everything in Python - I hope in a clean enough way - so that others will be tempted to use this method. 

This new implementation relies only on Numpy and Numba for optimized calculations, and on Matplotlib to display the results. 
 
I've cooked up examples to show how to use Trackpy results stored in Pandas dataframes as positions and how scipy.spatial can be used to define bonds.
 
Following the title of the original paper, the code is named DiRDiP, for Discrete Rearranging Disordered Patterns.
 
The code can be cited using the DOI provided by Zenodo: 
Mathieu Leocmach, DiRDiP, https://doi.org/10.5281/zenodo.4276047 (2020)


What the code takes as input

  • Two arrays of coordinates at two different times. The dimensionality is arbitray, but for most applications 2D and 3D will be enough.
  • Two sets of bonds, each linking positions at one of the two times.
  • A grid on which to compute the continuous description. I've implemented the rectilinear grid in any dimension, the regular grid in any dimension, and the polar grid in 2D. Implementing other grids (spherical, cylindrical, etc) would be rather easy.

What the code outputs

Arrays of matrices, one matrix per grid element. Exemple of matrices (as defined in the paper):
  • statistical velocity gradient
  • statistical rotation rate
  • statistical topological rearrangement rate

There is a submodule dedicated to displaying such arrays of matrices in Matplotlib.

What the code does not do

  • Localize interesting points and link their positions in time. Use Trackpy for that, or what fits to your problem.
  • Decide which points are linked together. This dependes so much on the physics or biology of your system. Some possible geometrical criteria are implemented in scipy.spatial, like Voronoi neighbourhood, k-nearest neighbours, distance criterion, etc.
  • Decide how to average the results to obtain statistical significance. But you know, averaging numpy arrays is pretty easy. For example, if you have a seady state, you may want to average in time the arrays resulting from two successive time steps. If you have a spatial symmetry or invariance in your system, you may want to exploit it.

What I am proud of

  • Unit tests
  • Documentation of each function
  • Some examples

What it still lack to be perfect

  • A tutorial
  • A generated documentation 
  • More users

Tuesday, February 9, 2016

Layered cake and floating crystals

Mille crepe. By Laitr Keiows - Own work, CC BY-SA 3.0,


The soil we stand on is like a mille crepe, a layered cake made by the slow deposition of solid matter on an ocean bottom, each era adding a layer of a different nature. The process that makes particles even slightly denser than water settle down is called sedimentation.

A particle is pulled down by gravity, slowed down by the viscosity of the solvent. It also gets kicked randomly by the atoms around. For a large and heavy particle like a canon ball this random motion is negligible and the particle sediment to the bottom. For a small and almost buoyant particle like a protein, this random motion dominates and the particle diffuses in any direction. In between we have the so called sedimentation-diffusion equilibrium. Particles settle down, but also diffuse up, and we observe that the concentration of particles changes depending on height. At the bottom we count more particles than at the top. This is what we call a density profile.

Equilibrium density profiles are a great tool for physicist. By measuring them, you can learn how your particles behave as a system. For example, if you observe a density that decreases exponentially with altitude, you known that the suspension behaves like an "ideal gas", which means that the particles almost do not interact. That's more or less the density profile of the gases in the atmosphere.

If you observe a sudden jump in a density profile, it means that you have an interface between two phases. For example between a gas of particles and a liquid of particles.

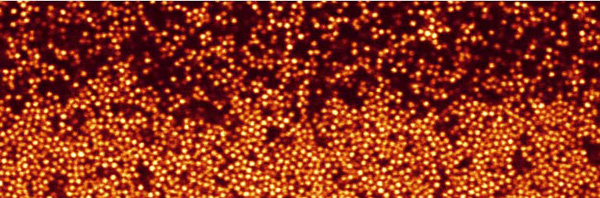
A colloidal gas-liquid interface. Picture by Paddy Royall.
If your particles are all the same size, you can even observe two consecutive jumps, from gas to liquid and then from liquid to crystal, where the particles are neatly aligned. Particles with different sizes would jumble the alignment. In general, it is quite difficult to make particles of different size crystallize.


There are several ways to get to this triple coexistence situation.  One possibility is that you first have the gas and the liquid that separate, and then the crystal forms from the liquid. A second possibility is crystals condensing from the liquid, settling down in sufficient quantities and only then does the liquid evaporates to form a gas layer on top. A third possibility is the crystals forming at the same time as gas bubbles, racing to the bottom or the top respectively. Only when gas and crystal layers sit on top of each other does some of the crystal melts to form a liquid layer in between.

My contribution was to add some more complexity to the first scenario. What if I add a few large particles (green) in the suspension of small particles (red) ?

At first, nothing changes: on top a gas that has almost no particle and on the bottom a mixture of many small and a few large particles.  If there was only small particles crystals would form at the bottom. But the large particles get in the way and no crystallisation occurs at the bottom.

Meanwhile the large particles settle faster than the small ones. So at the top of the liquid we soon have a layer devoid of large particles. Only small particles? Easy to make crystals then (big red blobs on the video below). Crystals are large, compact, and fall even faster than large particles. They outpace them and dive in the dense mixture of large and small particles. Splash!


And here we have something unexpected: the crystals float! I mean, yes, ice floats over water, we are accustomed to this. But water is an exception. Solid metal sink down into molten metal.


Actually we demonstrates that the mixture of small and large particles can get so dense without crystallizing that crystals made only of small particles can float in it.

The crystals are reasonably happy in there, not melting but not growing either. Since crystals are dropped continuously from the top, they end up filling pretty much the whole pool (where the large particles are) and even piling up over the level of the large particles.

Now the crystals that are over the level of the pool have no large particles to prevent their growth, so they grow and make a dense "ice pack" on top of the pool.

Final state of the limit between floating crystals (below) and the ice pack (above). This is the same place as the video above.


At the end, you get a pretty layered cake: gas on top, then a layer of liquid, then the ice pack, then the crystals made of small particles floating in the pool of large and small particles.

Details of the full layered sediment. Top: gas-liquid interface. Middle: ice pack. Bottom: crystals made of small particles in a small+large amorphous matrix.


Leocmach, M., Royall, C. P., & Tanaka, H. (2010). Novel zone formation due to interplay between sedimentation and phase ordering. EPL (Europhysics Letters), 89(3), 38006. doi:10.1209/0295-5075/89/38006
http://arxiv.org/abs/1402.0315

Wednesday, July 15, 2015

Food science

At the beginning of June, I had the pleasure to attend my first conference about food science: The 7th International Symposium on Food Rheology and Structure.

I love food, my family loves food. With my sisters and brother we talk about food almost each time we meet. My aunts and uncles do the same. We love making food for each others and for our guests. My wife has the same kind of sensibility.

I love food, I love to cook. I love to improvise a new dish. I have dozens of spices in my kitchen, and I try to master their use, alone or in combination. I became versed in some recipes, likes lasagne bolognese, but I take on new challenges as often as possible. I often knead pasta or udon, I made chocolate éclair when they were impossible to find in Tokyo.

I love food, I love to understand it. My scientist brain can't be turned off when I cook. Mayonnaise is an emulsion, flour a granular material. When I make white sauce, the size of the eddies generated by my spoon is a visual indication of the Reynolds number and thus the viscosity of the sauce undergoing a sol-gel transition. Boiling water is a thermostat at 100°C.

I love food, I study it. My first independent project as an undergrad was about mayonnaise. Then I learned that soft matter science was a thing and went up to the PhD studying rather inedible soft materials. Freshly arrived in France as a postdoc, my new boss asked me if I wanted to study "waxy crude oil" or yoghurt. Of course I chose the later. I studied it as a physicist during 3 years and now finally I was able to present my results to food scientists.

I love food, but I am not a food scientist. I am not trying to formulate a new yoghurt. I don't make the link between the mouth feel adjectives rated by a panel of trained consumers and mechanical measurements. I am more interested by the physics that it reachable through the study of food systems.

I love food, and it was a pleasure to meet the food science community. I discovered very interesting systems, I heard interesting questions being raised, I received nice feedbacks about my contribution (see below). I even met a reader of this blog, hello Dilek!


I love food, I will meet this community again. I have been invited to Journées Scientifiques sur le thème Matière Molle pour la Science des Aliments, a conference to unite the French food science community. It will be held in October 28-29 in Montpellier.


Thursday, May 15, 2014

Strange patterns

For more than a year, I am trying to understand that


Or more dynamically, this


This is no leopard or fish skin pattern, nor salad dressing-like demixing. It appears when I make a yogurt in a very thin container, actually in a gap of a tenth of a millimetre thick, between two glass plates. Important detail: the glass is made extremely slippery, nothing appears with usually sticky glass.


The pattern is random but there is a well defined size. I can change the thickness of the cell (from 50 microns to one millimetre) and the pattern will scale up accordingly.


By the way, there is nothing living in my yogurt, no bacteria. The gelation is induced by slow and homogeneous acidification by chemicals. You can see the process of gel formation at high magnification in the video below. At first, things move around, this is Brownian motion. Then the gel forms and everything stops. Then the pattern appears.


It took me a couple of month to understand what these patterns are. I let you guess until next time.


Sunday, April 27, 2014

Testing rupture models

How do materials break ? This question is the starting point of my present post-doc in France. People have good ideas on how metals and crystals break, because their structures are known for a century or two. But when you turn your attention to more messy materials, like composites, concrete, paper, gels, etc. the answers are far less convincing.


concrete 8

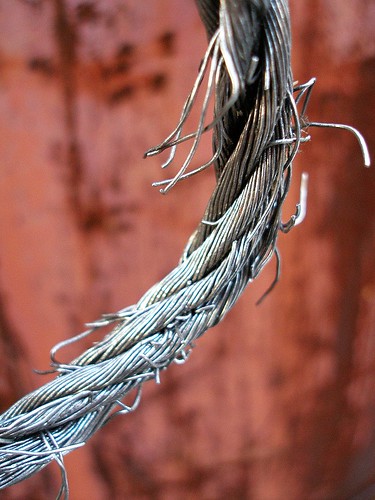
Popular (because simple) models of fractures are called fibre bundle models. Imagine a cotton yarn, or a rope made of many interlocked fibres. If you pull on it hard enough and for long enough, a fibre will break. The pulling strength will be shared by all the other fibres, until an other one breaks. The more broken fibres, the less remaining fibres, the more often a new fibre breaks. Sounds like a random action movie scene, isn't it?


Breaking wire rope

A first simple model is to consider that the fibres are independent from each other and each of them has a slightly different breaking threshold. The only way fibres interact with each other is by sharing evenly the load. This model is good at describing how paper breaks. It predicts that over a given load threshold, the material will always break. The stronger you pull, the faster it breaks, conversely if you pull just a minute amount above the threshold it will take a very long time to break. For most of the process, you may even not notice that you are damaging your rope. That's why in the movies it's always when the last guy crossing the rope bridge who falls.


A mode refined version of the model says that when a fibre breaks, the load it bear is split among its neighbouring fibres. It makes sense when you consider an actual rope, made of smaller twines, made of even smaller threads, etc. until you get to the individual fibres. What this new model predicts is the absence of threshold load. If you pull on your material long enough, it will break, whatever your strength. Of course, the weaker you are, the longer you'll have to wait. An other interesting prediction is the appearance of fractures, or regions where all the fibres are broken. Can this explain the fractures and cracks observed in many materials? That's on this question that I started my own research.


I selected a system that indeed looks like a network of fibres:

Casein gel seen by Transmission Electron Microscopy from Kaláb 1983
This is a gel obtained by slow acidification of a solution of milk protein (sodium caseinate), or in plain English: a yoghurt. The picture above was made by electron microscopy, and the white fibres you see are one hundred time thinner that a human hair. The black voids are occupied my water that flows throughout the network.


Unstirred yoghurt do behave very much like a hard solid, except that it is much weaker. You don't need a powerful machine to fracture it, a spoon is enough.

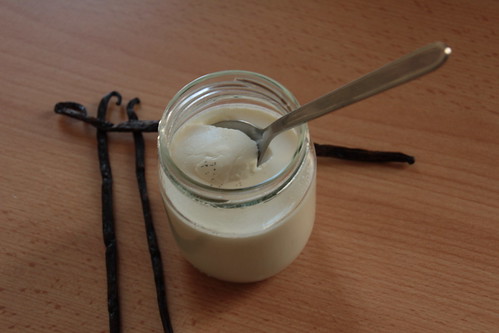
Yaourt à la vanille

And once it is broken, the cracks won't heal. It is very different from a liquid or from pastes that you can stir to erase the memory of the system. If you stir a yoghurt you just destroy it further.


Sketch of a Couette cell an visualisation of the fractures

Now, I don't trust myself to apply a constant force with a spoon, especially if the experiment is set to run for a week. So I make my yoghurt between two concentric cylinders of a machine called a rheometer, which is able to rotate the inner cylinder with a constant force until the next power cut. Step by step: I pour the protein solution in the rheometer at rest, the gel forms during 17 hours as the solution acidifies, and only then I apply the force.


As you see on the picture above, after some time fractures appear in the yoghurt and grow vertically. By the way, the picture was taken by a standard webcam. This is not rocket science. The picture above shows only the bottom half of the yoghurt, there are fracture also growing from the top. When bottom and top fracture meet, the gel breaks completely.


I repeated this experiment many times, varying the applied load and thus the time needed to break the yoghurt completely. At high load, I am limited by the recording frequency of the rheometer, so my minimal breaking time is slightly less that a second. On low load, patience is the limiting factor, as well as evaporation and mold growth. Still I have an experiment that lasted 11 days. That is a factor 10 million between the longest and shortest experiments, enough to prove that there is no meaningful load threshold. That is a first win for the model.


Edit March 29th, 2014

A video of the rupture. Nothing seems to append and then ...

Sunday, February 10, 2013

Up-goer five Glass

Here is my attempt to explain my thesis using only the ten hundred most used words in English. I used the marvellous Up-Goer Five text editor by Theo Sanderson inspired by XKCD.

When you cool a water-like stuff, you get a hard stuff. In many hard stuffs, the bits are lining straight. But in other hard stuffs there is no straight line.

The hard stuff that make the walls of a can do have straight lines. Because of those lines you can make the can smaller by pushing down on it without breaking it into pieces. Window glass has no line, so if you push it too strong it will break into pieces, but if you push it just a little bit it is harder that a can, you can't make it smaller by pushing it. Having no lines makes hard stuffs even harder. Also, that is because there is no straight line in window glass that the light can get through, straight lines stop light or make it funny.

Sometimes you want very very hard stuffs, or see-through hard stuffs, so you don't want lines in it. Sometimes you want hard stuffs that you can push hard without breaking, or hard stuff that stop light or make it funny, so you need lines. It is very important to know how to make lines or not to make lines.

The problem is: no one knows how to control the lines. Also, no one knows why stuffs without lines can be hard at all!

Water-like stuffs have no lines and they are not hard. So it is not lines that decide if a stuff is hard or not. What decides then? People had this idea: if bits of stuff group together they become hard. If you stick those groups together, you can make hard stuff. You can group bits of stuff by five, that makes them very hard. You can also makes groups of six which are quite hard.

By the way, if you make groups of six, it is easy to make lines out of it, so you have made a hard stuff with lines. But if you make groups of five, you can't make lines, so you have made a hard stuff without lines.

Is this idea right? To know this, I looked at stuffs that are still water-like but cold enough to become hard. If I cool down a little more, they become hard stuff without line. These stuffs are in between water-like stuff and no-line-hard stuff. Actually they are a little bit hard. People found that some parts of it are slow and some parts are fast. The colder you get, the larger those fast and slow parts become.

What people think, it that hard parts must be slow. So I looked if there was groups of five or groups of six, there was, and if they are slow or fast. I found that both kind of groups are slow, but groups of six are much slower than groups of five. This is a surprise! Also, I found that the more I cool down, the more groups of six I see. I don't see more groups of five. So it is the groups of six that are important to make the stuff hard, not the groups of five.

So, what makes stuffs without lines hard is not groups that can't make lines. It is groups that could make lines but there is something in the way. Maybe that is the groups of five that get in the way.

Saturday, March 17, 2012

Count on your neighbour

Counting how many stuff you have is important
Scrooge counting his money
... but boring
counting sheeps
During last week, I saw a few times one of my fellow lab member printing a picture like this
Phase contrast microscopy picture of nucleation
and putting a cross on each white object. He was counting them. The first time I saw this, I thought he had to do it for one or two pictures. But at the end of the week, I asked him what he was doing and if I could help.


The above picture is taken when a phase A nucleates into a phase B. This appends for example if you cool a liquid below it's crystallization temperature. A crystal nucleus will appear from time to time and grow. The probability to form a nucleus (nucleation rate) is a very important physical parameter: if nucleation is extremely rare, you will have a single nucleus in you bottle that will grow to form a single crystal before the birth of the next nucleus. This is exactly what you want for example when you make a silicon wafer for microelectronics. If nucleation rate is high, then you will have many nuclei growing at the same time and at the end a material that is made of many different crystals. You may want this in ice creams, because small crystals have a more pleasant texture than big ones.


The only method to measure the nucleation rate in a given system is to count the number of nuclei function of time. So my colleague was counting ... for the whole week. He had done two dozens of experiments at different temperatures and compositions, and took a series of picture for each (like every couple of second for a few minutes). This makes hundreds if not thousands of pictures to analyze. And his plan was to do it by hand.

Try to count how many nuclei are in the above picture. This is a task that need careful attention: large nuclei have a good contrast, but there are many smaller ones very difficult to tell from the background. That's why my colleague was printing and crossing the counted nuclei.

As I told you in a previous post, this kind of procedure can be fully automatized. The programming takes time, so if you have only a few pictures to analyze, this may not be a good idea. In addition, this counting is tricky because the objects can have very different sizes and contrasts. However I, sitting 3 steps away, had already developed and tested such a program. The physical signification is different (I am tracking polydisperse colloidal particles) but the technology is the same. So yes, I could help.

An hour later my colleague had in his computer a script counting the nuclei for him, a picture per second or less, automated to treat a whole time series automatically without human intervention. Setting-up Python and dependencies on his computer took half of the time. We should have communicated earlier, before he had spent a week doing what the script could do in an hour.

Result of the localization. Original image (red) superimposed with localized positions (cyan squares)
As you can see on the picture above, the result is not 100% perfect, but quite close. For example there are problems when nuclei are fusing and there are also (very few) centers counted multiple times. I think I know how to adapt better my program to this situation, but my colleague told me it was enough precision for him.

This gives an other motivation to explain (in a future post) how this counting/localizing method is working.

Saturday, December 17, 2011

Unifiying conference

I am frustrated when I cannot go to an international conference once a year. But at the end of it I am worn out. Usually it lasts a week. This time it was two weeks in a row. I wonder how I am still able to think.

International scientific conference are at the heart of the research world, at least as important as scientific publications. Without conferences, you would not know who is working in your field. That is where you discover that paper authors are not only names but human beings. Dr. X who is contradicting your results is actually a very friendly guy an the best person to chat to or to go to restaurant with. Pr. Y whose intuitions are always stunningly genial can be a frightening freak, a reckless egocentric or ... a very seducing man/woman.

There are the personalities you discover and the ones you are eager to meet again. From conferences to conferences the bonds tighten (often despite the scientific disagreements) and from these irregular contacts emerges a community, a human community closely related to the abstract "scientific community".

But scientific conferences are not only a bunch of old chaps meeting once a year. This is a powerful way to exchange ideas and to be able to dig into what other researchers have discovered. If you have read someone's paper, you are able to ask him/her questions to clarify and discuss his/her work. If not, hearing his/her presentation may make you read the referring article.

In practice, a conference consists in a series of oral presentations of various lengths. Typically a researcher invited by the organisers will have an hour to expose his/her research in front of everybody, a researcher selected by the organisers will have 30 minutes, and the others will have only a poster presentation. I am at the poster level, so I stuff my results on a A0 that I hang in the dedicated place off the conference hall and during the so called "poster session" time I stand by, ready to explain my work to anybody interested. This also implies some advertising skill beforehand.
My poster for Unifying Concepts in Glass Physics 2011
Except your short time under the spotlight (your talk or your poster session), the conference consists mainly in listening to other's stories. In the past week I have listen to 8-10 talks every day, each representing at least months and more probably years of work condensed in 30 minutes or an hour. The previous week was more like 6 talks a day. Anyway, this is an enormous amount of information, a all you can eat buffet that I will slowly digest from now on.

I will probably post here in the future some reflexions or discussions that result from this conference.

Sunday, November 27, 2011

Seminar and meetings in France

I'm giving a seminar in the Ecole Normale Supérieure (ENS) in Lyon, France the 6th of December. Just after that I'll be in Paris for 2 consecutive meetings:
Both seminar and poster are about the same stuff I talked about in Kanto-softmatter workshop and in a previous post. Here is the more formal abstract.
A link between local structural ordering and slow dynamics has recently attracted much attention from the context of the origin of glassy slow dynamics [1, 2]. There have been a few candidates for such structural order [3, 4], icosahedral order, exotic amorphous order, and crystal-like order. Each type of order is linked to a different scenario of glass transition. Thus, revealing the order responsible for slow dynamics is crucial for our understanding of the glass transition. Here we experimentally access local structural order in polydisperse hard spheres by its particle-level observation with confocal microscopy. We identify the key structures as icosahedral and face-centred-cubic(fcc)-like order, excluding any other simple local symmetry. We find that both types of order are statistically associated with slow particles. However, when approaching the glass transition, the icosahedral order does not grow in size whereas crystal-like structures grow. It is the latter that governs the dynamics and is linked to dynamic heterogeneity. This questions the direct roles of the icosahedral ordering in glassy slow dynamics and stresses the importance of the structural order compatible with the avoided first order transition, crystallization. Our finding also suggests that the growing lengthscale of structural order is essential for the slowing down of dynamics and the nonlocal cooperativity in particle motion.

References

  1. Cavagna, A. Supercooled liquids for pedestrians. Physics Reports 476, 51124, 2009.
  2. Berthier, L. & Biroli, G. Theoretical perspective on the glass transition and amorphous materials. Rev. Mod. Phys. 83, 587, 2011.
  3. Steinhardt, P., Nelson, D. & Ronchetti, M. Bond-orientational order in liquids and glasses. Phys. Rev. B 28, 784805, 1983.
  4. Tarjus, G., Kivelson, S. A., Nussinov, Z. & Viot, P. The frustration-based approach of super-cooled liquids and the glass transition: a review and critical assessment. J. Phys.: Condens. Matter 17, R114R1182, 2005.
  5. Lubchenko, V. & Wolynes, P. Theory of structural glasses and supercooled liquids. Annu. Rev. Phys. Chem. 58, 235266, 2007.
  6. Tanaka, H., Kawasaki, T., Shintani, H. & Watanabe, K. Critical-like behaviour of glass-forming liquids. Nature materials 9, 324Ð31, 2010.
Reconstruction from confocal microscopy coordinates. Only structured particles are shown for clarity.

Wednesday, November 16, 2011

Particle tracking I : from analog to digital


Pinpointing the positions and sizes of tens of thousands particles from pictures. I can't miss one, I can't detect a particle where there is none. The precision must be extremely high. That is what I am doing routinely as the basis of my research. If I don't get this step right, my research has feet of clay, standing on sand.

In 1905 Einstein published three papers founding or revealing three different fields of physics : relativity, quantum mechanics and Brownian motion. The last one is a major breakthrough in statistical physics because if it was true, then matter was discontinuous, made of particles like atoms or molecules. However an experimental proof was needed.
Jean Baptiste Perrin

Jean Perrin exhibited this proof by the following experiments around 1908 : he suspended microscopic gamboge particles in water and waited for them to settle. Obviously their were more particles at the bottom than at the top ; however, how many more ? Perrin took a microscope and counted : how many particles do I see in average in a drop of suspension taken at 1 cm from the bottom (do it for 1000 drops to get a good average) ? How many at 2 cm ? etc. The concentration profile he got was perfectly fitting with theoretical predictions and thus discontinuity of matter was proved. Jean Perrin got the Nobel prize in physics 1926 for that.

A century later, how do you do track particles ? First, you don't need to stick your eye to a microscope. You take a digital picture with a CCD camera adapted to the microscope. Of course you can take movies.
A typical image of a dense colloidal suspension, taken by confocal microscope.
Now you have about ten thousand pictures like that out of a single experiment. Of course, you can superimpose the picture with a grid, locate the coordinates of a particle by following the grid with your finger, write them down in a notebook and so on and so forth. Perrin could have done that during years, but we have computer slaves.

Crocker and Grier designed the following algorithm to track individual particles from pictures. It is probably easier to understand if we imagine the intensity of each pixel as an altitude. For example, the two pictures below are equivalent.

Noisy picture of particles
Corresponding intensity profile
Blur your image to remove noise and to smooth the particles' intensity profile. Each particle should become a peak with no flatness at the top.

Previous picture, blurred


Find the pixels that are local intensity maxima. Their must be one per particle + others due to noise.
Local maxima


If you have large areas without particles, you may find local maxima there due to noise. If you remove the local maxima that are not bright enough, you should be left with only particles, none from noise. Now you know the coordinates of each particle centre with discreet (pixel) precision.
To increase the precision, you can take the centre of mass (intensity) of the pixels surrounding each possible centre. This gives subpixel resolution (about 1/10th of a pixel).

This is an extremely quick and efficient algorithm used routinely by many groups either in 2D or in 3D (yes, you can take 3D pictures, I'll have a post about it). You can check the official web page for more information. My own code for that is on sourceforge.

So far so good if your particles have the same size ... something that almost never append in nature, and not that often in experiments. I'll write about the more-than-one-size case in an other post.

Friday, November 11, 2011

Kanto softmatter talk

A busy week is ending ... almost. I give a talk tomorrow at a workshop (yes, a Saturday !), on Monday I submit a research proposal to be paid from April. And after that I will have to work again on a paper that has been rejected.

Tomorrow is the kanto softmatter workshop, a very local meeting for the soft matter labs around Tokyo. Talks are only given by young researchers, not by big names. That is why I have an opportunity to talk. In larger conferences until now I only got poster presentations. Well, there is no bed of roses.

I will talk about my thesis work, in particular the content of the paper that was rejected: what are the local structures playing a role in a model of glass transition and which one is more important than the other. The answer is rather surprising. A glass is amorphous, so most people think that a glass is the opposite of a crystal. Therefore if glass has a structure this structure must be very different and incompatible with the crystal symmetry. That's why icosahedral order is often exhibited as a typical glass order.

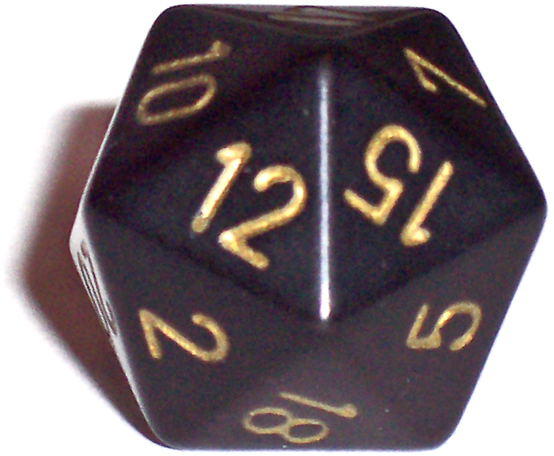
A icosahedron is a solid with 20 identical faces. Like this dice used in Dungeons&Dragons.
via Wikimedia
13 particles forming a perfect icosahedron, from my thesis
As you can see, there are pentagons everywhere in that structure: icosahedron has 5-fold symmetries. The problem with five-fold symmetry is that it cannot pave space (at least in 2D and 3D). Try to pack them together and you will always have gaps.
By JF Sadoc via Wikimedia

However, the icosahedron is very dense and often maximises locally the interaction energy between the particles. Icosahedral order is locally the best structure, so it forms easily in a dense liquid, but cannot spread. That is what is called frustration.

What one can image in a supercooled liquid is icosahedral bits, probably forming a sort of network or fractal, and total disorder in the gaps. The icosahedral structure is stable, so is moves very slowly and slows the overall dynamics. If we are still in the liquid a given icosahedral bit will eventually disappears while order is formed elsewhere, but in the glass even that rearrangement is forbidden, too costly in energy to append in a reasonable time, so everything is stuck. Here is an explanation of the glass transition.

Another explanation (advertise by my boss, so my judgement may be biased) is that a supercooled liquid is by definition metastable to the crystal, so the liquids "wants" to become a crystal. Things are getting in the way (like icosahedron for example) so the crystal is not formed. However, there are stuffs in the supercooled liquid that look like a little bit like crystals. Not very healthy crystal if you pass me the expression; hunchbacks, twisted legs, broken faces, no arms ... still if you look close enough the local structure is closer to the crystal than anything else.
a) displacements b) crystalline order and c) number of neighbours in a 2D shaken granular supercooled fluid. From Keiji Watanabe and Hajime Tanaka,
Physical Review Letters (2008).
Once you have a method to detect these crystal-like stuffs, which has been done in an handful of models, you discover that they are slower than the rest of the liquid and that their size is growing when you get closer to the glass transition. Paradoxically isn't it the crystal that is responsible for the slowing down to the glass ?

Who is slowing down the system ? The locally favoured structure of the fluid or the influence of the crystal ? To answer this question I used a system that has independently icosahedra and crystal-like structures. In a few systems, people have found very slow icosahedral structures and some of them exhibited it as the proof that liquid order was the culprit. However others remarked that the "crystal" in these systems actually contains some icosahedral motifs. For example if the "crystal" is in fact a quasicrystal with five-fold symmetry, you cannot tell if the icosahedra that you see in the supercooled liquid come from the locally favoured structure of the liquid or as crystal-like stuff.
A Frank-Kasper phase, which is a crystal containing icosahedra (large blue spheres). From the Trebin lab in the university of Stuttgart.
A quasicrystal with icosahedral symmetry, via Wikimedia


To avoid that confusion, my system has a well known crystal of face centered cubic structure, without a glimpse of icosahedron in it. In addition, icosahedral order is locally favoured. In that situation, no mistake possible, the slower structure wins.

And at the end, I found that the icosahedral bits play very little role in the slowing down, the crystal-like bits are doing all the slowing work. Of course Icosahedral order plays a role : it is frustrating the crystallisation, and that is thanks to that frustration that we are able to supercool the liquid in the first place. However, that is the influence of the crystal that governs the slowing down and thus the glass transition.

Details in the paper to come ... when accepted.