Flocking of birds and schooling of fishes are phenomena analogue to the
separation of water and oil or of water and vapour. Birds like to be
together rather than evenly fill the sky. So do water molecules that
mostly gather in a glass and sparsely populate the volume of the room
around. In the last decade, this analogy has been explored by
physicists. It holds incredibly well given that molecules passively
respond to the surrounding temperature, whereas birds and fishes
self-propel, thus actively inject energy in the physical system. Bird
flocks and fish schools are thus intrinsically out-of-equilibrium
systems. More generally, other physical systems, made of living or
abiotic particles, have been shown to phase separate between dense
and dilute regions when the particles are gifted with
self-propulsion. But how far does the analogy run with water-vapour
passive equilibrium situation ?
Theories and
simulations have identified the interface between the dense and the
dilute phase as a place where the analogy might break down and give
rise to new interesting phenomena. For instance, a negative surface
tension has been predicted in some models of active systems. Instead
of minimizing the interface area as a positive surface tension does,
a negative surface tension should lead to an increasingly corrugated
interface. But other models predict a positive surface tension and
more subtle discrepancies with an equilibrium interface.
In this context, we
set to reproduce the active matter version of the capillary rise
experiment, where water in contact with a hydrophilic wall forms a
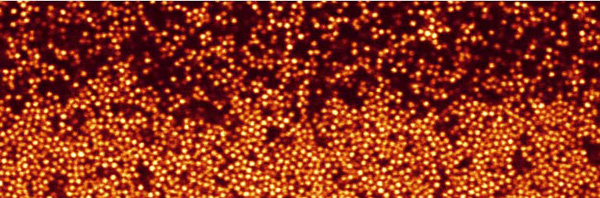
meniscus against gravity. We studied a sediment of 2 µm spherical
gold particles in contact with a vertical wall. One hemisphere of
each particle is coated in platinum. The platinum is able to split a
chemical fuel and this reaction propels the particle. In absence of
fuel, the particles are passive and do not wet the wall. When we add
fuel, the particles become active and climb up the wall.
Surprisingly, this climbing occurs at relatively weak
self-propulsion, too weak to induce phase separation, too weak to
create an interface with a surface tension.
Indeed, we do not
observe a meniscus, but an adsorbed layer, one particle thick. And in
this layer, the particles point upward, actively climbing against
gravity, a phenomenon that has no analogue in a passive system. With
the help of numerical simulations, we were able to understand the
necessary physical ingredients to observe this phenomenon. We
understood that the particles need to align parallel to the wall, as
elongated bacteria do. However, against an horizontal wall, particles
can go indifferently right or left. What makes them go preferentially
up in the case of a vertical wall?
To understand this,
we had to remember previous studies of active particles in a
sediment, but far from any wall. Models had predicted, and the
experiments of some of us had confirmed, that high in a sediment the
particles were pointing slightly upward. Indeed, to climb this far
up, a particle had to be pointed upward just before the observation.
If it was pointing downward, its propulsion would concur with gravity
to make it fall down. Since the self-propulsion is persistent,
particles that were pointing upward just before the observation are
mostly still pointing upward. That is how gravity selects particles
that point up. But far from any wall this propulsion slightly upward
exactly compensate the gravity and the system is in steady state. By
contrast at a wall, this small preference to point upward is enhanced
by the alignment. Particles thus point exactly up. Their
self-propulsion is now stronger than gravity and the particles climb
up the wall in a steady state flux that has no equivalent in passive
systems.
Effectively, a
vertical wall is able to create a steady current in an active system.
By herding active particles it makes them climb up against gravity.
From microscopic active units, this simple situation produces a
macroscopic work. Our results pave the way to microfluidic circuits
able to pump themselves.
Imagine you have a set of points evolving in time. It can be the center of colloidal particles in a suspension, of cell nuclei in a tissue, of bubbles in a foam, of people in a crowd. You also have a way of defining which point is bonded to which one. Two people are bonded if they hold hands. Two nuclei are bonded if their respective cell membranes touch. Two bubbles are bonded if they share a soap film. Two colloidal particles are bonded if they are within a certain distance from each other.
And now you make this dynamical, with people moving and handshaking around, bubbles deforming to flow through a funnel, colloidal suspension beeing sheared, tissue trying to fix the scar of a scalpel cut. Your points are moving and your bonds can stretch, rotate, break or be born.
A set of 9 positions with bonds between them, evolving in time. The positions can move, the bonds can appear (green) or disappear (red).
How would you characterize this mess? How to make statistically significant observations of such an ensemble of discreet events? How to deduce anything about the response properties of your system?
One way is to translate the original discreet description of the evolution of the system (discreet points moving and discreet bonds deforming, appearing or disappearing) into a continuous description in terms of strain field. Even better, in terms of strain fields: the reversible part of the strain that correspond to the bonds that deform without breaking on one hand, and on the other hand the irreversible part of the strain that corresponds to the bonds that appear or disappear.
It's based on a great method published by François Graner and Benjamin Dollet in 2008 that allow to go from the set of point to the mechanical properties of the system. This paper is great, pedestrian and extremely clear on every detail. I really recommend the read if you know a bit about strain tensors and continuous mechanics.
Unfortunately, the original implementation of this analysis in Delphi was lost and later implementations in Matlab were never brought to releasable form. That is why I reimplemented everything in Python - I hope in a clean enough way - so that others will be tempted to use this method.
This new implementation relies only on Numpy and Numba for optimized calculations, and on Matplotlibto display the results.
I've cooked up examples to show how to use Trackpy results stored inPandas dataframes as positions and how scipy.spatial can be used to define bonds.
Following the title of the original paper, the code is named DiRDiP, for Discrete Rearranging Disordered Patterns.
The code can be cited using the DOI provided by Zenodo:
Two arrays of coordinates at two different times. The dimensionality is arbitray, but for most applications 2D and 3D will be enough.
Two sets of bonds, each linking positions at one of the two times.
A grid on which to compute the continuous description. I've implemented the rectilinear grid in any dimension, the regular grid in any dimension, and the polar grid in 2D. Implementing other grids (spherical, cylindrical, etc) would be rather easy.
What the code outputs
Arrays of matrices, one matrix per grid element. Exemple of matrices (as defined in the paper):
statistical velocity gradient
statistical rotation rate
statistical topological rearrangement rate
There is a submodule dedicated to displaying such arrays of matrices in Matplotlib.
What the code does not do
Localize interesting points and link their positions in time. Use Trackpy for that, or what fits to your problem.
Decide which points are linked together. This dependes so much on the physics or biology of your system. Some possible geometrical criteria are implemented in scipy.spatial, like Voronoi neighbourhood, k-nearest neighbours, distance criterion, etc.
Decide how to average the results to obtain statistical significance. But you know, averaging numpy arrays is pretty easy. For example, if you have a seady state, you may want to average in time the arrays resulting from two successive time steps. If you have a spatial symmetry or invariance in your system, you may want to exploit it.
Recently, I am trying to figure out how to detect topological changes in a gel network as it breaks. In other words, I am tracking contacts as a network is loosing its connectivity.
As the schools and universities are closing, as I am myself practicing social distancing, the irony is not lost on me.
My immediate and regular contacts are my wife and children, my parents and family living in the same city, my colleagues, the members of my akido club, the parents I meet at the bus stop, friends I see for games, and more distantly the people on the market, at the canteen and in public transportation.
This last one is limited to a minimum since I am mostly commuting by bicycle. I won't meet other parents now that schools are closed. Social distancing means for me: not going to aikido (the club will close anyway), moving games online, not meeting my parents and family in person. I will also work from home as much as possible, including avoiding the canteen. The two PhD students I advise are warned and we have ways to communicate online.
We'll get through this responsibly, limiting damage to public health and our research. That said, I'll go back to my network analysis on Monday, with 3 kids at home.
I write in LaTeX very often, either online via Overleaf, of locally on Texmaker.
Recently, I have to write a report in French, so I need to type accented characters, including "ê". On a french keyboard, one has to type the "dead key" "^" and then the key for "e". But when I did so in Texmaker, I only got the "e", not "ê", as if I did not push on the dead key "^". It was pretty general, since I could not even get the accent alone like in "\^{e}" or on any other letter â, û, î, ô, etc. Since everything was working fine on all other applications, it must be a Texmaker problem.
To make a long story, full of googling and forum and tials and errors, short, I discovered that is was a conflict between Qt (the graphical layer powering the interface of Texmaker) and ibus, the input method switcher I was using to write either in French or in Japanese.
The workaround I found was to install another input method switcher: fcitx.
Now I confess, this blog post is more a note for me to remember the procedure. But it may help others.
Type in the terminal im-config and select fcitx, validate
reboot (closing the session is not sufficient)
A keyboard icon shows up (on top bar for me). Right click, configure. Ask for your default keyboard (French for me). Validate and close.
Right click again on the keyboard icon, configure. Now you have access to all input methods, including mozc. Add mozc.
Selecting mosc on the list, click on the bottom icon showing some tools. In the menu, select the layout of your physical keyboard (French AZERTY for me). Validate and close.
Now, I might be a bit optimistic in this procedure because I actually tried much more things. Maybe between step 2 is actually more complex:
Gels are strange materials. They are mostly made of a liquid, however they are solid. This solidity comes from the structure of the gel: a dilute solid network.
Transmission electron micrograph of a casein gel.
See the network in the above picture? Here the strands of the network are made of aggregated proteins. The holes, or pores, are permeated by water.
A gel network can be made of various building blocks. For example if you take very long, linear molecules that you crosslink from time to time, you get a polymer network. If this network is swelled by a solvent, then it is a gel. That is the case of panna cotta, where long collagen molecules from the gelatin associate into a network to imprison the creamy milk.
In the case of a yogurt, you start from globular proteins called caseins (think of little balls) dispersed in water. If you make them attract each other, the proteins will spontaneously aggregate into a network.
From a mechanical point of view, these two cases look quite different. Long molecules are floppy, adopt many configurations. If you pull on such a long molecule, you are decreasing the number of configurations it can adopt. This is costly in terms of (free) energy, so it is hard to pull, as if the chain was a little spring. Now is you assemble such springs into a network, it is quite obvious that you will get a solid that is easy to deform.
Using the path in black, it is possible to go from one end of the sample to the other. This sample is percolated. The black path is a percolation path.
Now, if you assemble sticky balls into a network, and if you pull on it, will it deform elastically or immediately break down into pieces? What are the conditions to make a particle gel stable? The answer to these question is not obvious and there have been many different answers in the literature.
In polymer gels, having a percolating network is enough to have mechanical stability. Percolation means that it is possible to find a path along the network that goes from one end of the sample to the other. But many observation concluded that this was not enough to have mechanical stability in the case of particle gels.
A glass is mechanically stable because its particles are not able to rearrange, trapped by the cage formed by their neighbours. This concept was imported into gels by saying that particles were trapped by the attractive bonds they formed with their neighbours. This theory allows arrest, but does not explain the network structure of the gel. For a long time it was thought that a combination of percolation and glassy arrest could explain gel stability.
About a decade ago the paradigm shifted. There was this class of phase separation called "spinodal decomposition" that spontaneously formed a bicontinous pattern: a phase rich in particles intertwined with a phase poor in particles. Usually the pattern coarsen with time until complete separation of the phases. But it was found that if the particle-rich phase is dense enough to undergo a glass transition, then it becomes arrested and the structure stop evolving. So we get a network structure and thus a gel. This is called the arrested spinodal theory. However at very low volume fractions it does not describes well some observations. More importantly, it does not predicts the mechanical behaviour of the gel.
But there are other ideas in the literature that come more from a mechanical point of view. Back in the 19th century, Maxwell stated that mechanical stability was ensured if the number of mechanical constraints is equal to the number of degrees of freedom. From example, if you live in 3D space (I do), you have 6 degrees of freedom : you can move east, west, north, south, up and down and any combination of theses. If you are blocked so that you can't move north, can't move south, can't move east, can't move west, can't move up and can't move down, then you cannot move anywhere. So you are stable. This concept of "isostaticity" is very useful at the macroscopic scale, when you want to build a bridge or when you want to understand sand piles. But is this concept relevant when each particle is jiggling around due to thermal motion? In 2012, a paper found that when you look at a gel before and after breaking it, you find a decrease of the particles that have 6 or more bonds. These are actually the particles that should be stable, since each bond is a constrains, so higher than 6 you shouldn't be able to move.
In 2016, percolation stroke back. A paper found that not all paths along the network were important. If you considered only paths that never turned back, that were "directed", then you are interested in "directed percolation", not "isotropic percolation". The authors found that all their samples where directed percolation took place were mechanically stable, and that no other sample was. So, is directed percolation the cause of mechanical stability? For the moment, just remember that their samples were very dilute (less than 10% of particles).
The path in black is a percolation path that never turn back. This is a directed percolation path.
Here we arrive on the scene with our method to follow experimentally each individual particle during the process of gelation. All previous experiments were done by observing the state of the already formed gel. So the only influence that had been studied was the fraction of solid particles and the strength of the interactions. Here we add another axis: time.
We asked this question: can we observe when a gel become mechanically stable, and how is the microstructure changing at that moment?
First, we had to find a way of checking whether the suspension was mechanically stable or not. Usually you do that by putting the suspension in a rheometer, you oscillate at very low amplitude to measure the mechanical response. This response has two parts: elastic and viscous. If the viscous part is larger than the elastic part, the suspension is still liquid. If the elastic part is larger than the viscous part, the suspension is solid, so the gel has become mechanically stable. But in our case we need large (3 micron) particles to be able to observe everything in minute details. Large particles makes extremely soft gels. So soft that the rheometer does not have enough sensitivity.
Therefore, we ditch the idea of a rheometer altogether and only look at the response of the system to thermal agitation. The sample is just under the microscope and we record the trajectories of all the particles due to thermal agitation. If particles are able to diffuse away freely, it means that the suspension is liquid. If the particles are stuck and vibrate around a mean position, it means that the suspension is solid. Actually, a clever method call microrheology manages to transform the displacement of the particles into a measure of the mechanical response, elastic or viscous. In this way, we know exactly when our suspension becomes a mechanically stable gel.
In parallel, we can follow the progress of percolation. The usual isotropic percolation occurs always way before mechanical stability. Explanation (1) is out of the game.
We can also follow directed percolation. It occurs later than isotropic percolation, and actually for dilute gels (below 10-12% particle fraction), the time of directed percolation matches very well the time of mechanical stability. But, it does not work at all a higher volume fraction. Mechanical stability occurs sometimes 5-15 times later than the directed percolation. So, obviously explanation (5) is not general.
Now, we can look at isostatic particles, these particles that have 6 or more neighbours. Are these particles percolating? Yes, they are, and always at the exact time where mechanical stability sets in (see error bars in the paper, because science has error bars). So explanation (4) seems to be the correct one.
But then, why does explanation (4) give the right time at low particle fraction?
Look at the cartoons below. This is in 2 dimensions, so isostaticity means having 4 neighbours, not 6 like in 3D. Isostatic particles are shown in purple.
Path to gelation in the dilute case
In the dilute case (less than 10-12%)
When particles begin to aggregate, they form very loose clusters, very open and far from each other.
These clusters compact. Particles make more bonds within the same cluster, but clusters are too far away from each other to meet now. Because of this compaction, the heart of each cluster is now isostatic.
Clusters finally begin to meet and form larger and larger clusters, until you get a percolating path. In this situation, you have groups of isostatic particles that are bridged by floppy non-isostatic bridges.
In order to make more bonds, floppy bridges have to straighten. So at the time isostaticity percolates through the system, the network is mostly made of straight paths. So directed percolation is easy and occur at the same time.
Path to gelation in the dense case
In the dense case (more than 10-12%)
When particles begin to aggregate, they are so close together that there is no space between clusters. Very quickly a percolating network is formed.
That is only after the formation of this initial network that rearrangements occur. More bonds are created locally and this is enough to obtain a directed percolating path.
Compaction continues to proceed until isostaticity percolates. That only then that the gel is mechanically stable.
That explains why directed percolation looks like a good explanation if you look only at dilute samples.
To conclude, we can view a gel as a network that is sculpted and arrested by mechanical forces. Our mechanical explanation does not really contradict the arrested spinodal theory that is more thermodynamics. But we hope that explaining gels by mechanics will help understand the mechanics of gels. For example, we still do not understand why some particle gels break into well-defined and irreversible fractures (think yogurt) whereas some others just flow plastically and reversibly (think toothpaste or fresh cement).
If you want to dig more in depth, our paper is scheduled to be published the 31th of May 2019 in Science Advances, and a preprint is already available on ArXiv:
H. Tsurusawa, M. Leocmach, J. Russo, H. Tanaka, Direct link between mechanical stability in gels and percolation of isostatic particles. Sci. Adv. 5, eaav6090 (2019). arXiv:1804.04370
Have you ever seen the patterns made by birds, sheeps or insects when they come together? There is no boss in the mass of living bodies, however they self-organize.
The same kind of patterns can be seen at the microscopic scale in colonies of bacteria or in living tissues.
And recently, I've been working on non-living microscopic particles that self-propel, displaying the same kind of patterns.
Long exposure picture of self-propelled particles
A lot of beautiful physics has been done in the last decade about this class of system. Now it's known as "Active Matter".
Patterns are mesmerizing, physics is intellectually pleasing, but what is the purpose? What do you make out of this "Active Matter"? Can you build a bridge? Power your home? Cure cancer ?
Well, maybe.
It becomes clearer by the day that cancer metastasis is a swarm of cancer cells migrating through the body, very close to the above patterns. In which conditions the solid tumour becomes a liquid-like swarm? How to influence this transition? These are actual questions physicists and biophysicists are asking right now.
Maybe you can't power a house with active matter, but maybe you can make it do the worm of pumping the water of your shower. It has been found that a suspension of swimming micro-organisms flow more readily (has a lower viscosity) than the suspension of dead micro-organisms. Furthermore, in some situations, the viscosity is even lower than the liquid alone, without micro-organisms! They swim, converting their food into movement, and this moment helps the water flow up the pipe.
And can we build something? Maybe not a bridge, but a muscle that would be able to contract from the action of trillions of micro-motors. Or some kind of new material that would react to a push to the left by deforming to the right?
To understand this last point, I am looking for a PhD student interested in physics, mechanics, materials and afraid neither to code nor to perform experiments. This is an experimental investigation. See the announcement (2 pages, FR then EN) on my lab's website.
We have a paper out in Nature Materials on how crystallisation can help make a gel.
Tsurusawa, H., Russo, J., Leocmach, M., & Tanaka, H. (2017). Formation of porous crystals via viscoelastic phase separation.Nature Materials, 16(10), 1022–1028.
This is the second result of my collaboration with the lab of Hajime Tanaka, where I did my PhD. You haven't heard about the first result? We are still writing it down. In academia chronological order is not always granted.
It all started with a crazy idea from the boss and an even crazier “I'll try that” from a fresh PhD student around April 2008. It took Hideyo almost three years, including a depression, to hammer this idea into a working experimental setup and one more year to perform the experiments before graduating. Then he joined a private company and left me with a mountain of data to analyse. I had followed the story from the beginning as we started our PhD at the same time. I had completed my PhD on colloidal glass a year before he finished his about colloidal gels. Different subjects but many common methods. Hideyo was a skilled experimentalist, I was more keen on developing analysis methods.
We were both working with large colloidal particles (plastic balls of 3 microns in diameter) dispersed in an oily solvent. This system is perfect for observing in 3D at the particle level whatever physical phenomenon. The particles are charged and repel each other at long range. In water, you usually have plenty of dissolved ions. These ions tend to screen electrostatic repulsion, which means that same charges do not repel each other if they are further than 10 nm, at most 100 nm in extremely pure and neutral water. However in our oily solvent there are very few dissolved ions and electrostatic charges still can feel each other 10 microns apart.
Engineering interactions between colloidal particles. Refractive index matching and hairs ensures hard repulsion at contact. Charges provide long range repulsion but can be screened by ions. Non adsorbing polymers induces short range depletion attraction.
For me it was a bane since I wanted colloidal glasses, that is concentrated suspensions with particles close to contact. So I added some strange salts able to dissolve into the oil, providing ions that would shorten the range of repulsion. At that time, it was known that if you added polymers to the mix, they induced a short ranged attraction between particles and even at low particle content you could obtain a network of particles.
A colloidal gel observed by confocal microscopy
Such a solid network intertwined with a liquid solvent is called a gel. Yogurt is a gel, as most of our foods, organs, and many cosmetics. How gels form is still quite mysterious. We know that particles that attract each other would prefer to be grouped all together, leaving a large swath of empty solvent aside. A bit like when salad dressing unmix with oil on one side and vinegar on the other. Except that a yoghurt does not expel all the whey otherwise nobody wants to eat it. Some phenomenon stops the separation and allows the stability of the network. Except that your skin cream that was nice and stable yesterday just collapsed in a separated mess this morning. Nobody knows why and when a gel will suddenly lose its stability.
To understand that, we have to know why the phase separation arrests in the first place. We have to know how a gel forms. And for this we want to observe gel formation with our large colloids to be able to follow what is going on in every detail. But nobody knew how to do that.
Sketch of the semi-permeable cell
That when Hajime Tanaka had his crazy idea. Let's mix particles and polymers together but without salt. We have a short range attraction that is hidden by the long range repulsion. The suspension is stable with particles that stay far away from each other. We put this suspension in a chamber suitable for microscopy where the bottom is a membrane filter. Pore size is chosen so that neither colloidal particles nor polymers can go through, but salt can. Now we put everything under the microscope, add a salty solution on the other side of the membrane, and see the suspension forming a gel.
What is especially great with this idea is that with large particles and thin enough sample chamber ions diffuse so fast across the chamber that switching off the repulsion is practically instantaneous from the point of view of the slowly diffusing particles.
It seems simple but it took a couple of years or engineering to get the method right. Thanks Hideyo for toiling on that. Thanks also to John who analyzed a subset of the data and found that there was something strange going on; something that was at odd with existing models. Thanks also for calling me back to participate in that exciting story, even if I originally had to analyse a different subset of the data.
The most common model for gel formation relies on glass transition. If you cool a liquid without crystallising it it will slow down so much that it hardly flows anymore. One could wait the age of the universe before observing any flow. So practically what was a liquid is now a solid, disordered like a liquid. This is the definition of a glass. You can also obtain a glass by compression rather than cooling. The phase separation between a particle poor phase and a particle rich phase is analog to a gas-liquid phase separation. The colloidal gas contains almost only solvent and the colloidal liquid is very concentrated in particles. What the model says is that the liquid is son concentrated, so dense, that it become a glass. To sum up, a special type of phase separation (a “spinodal decomposition”) creates a liquid network, but this liquid becomes a glass and so the network arrests and becomes solid.
Reconstruction of gel structure. Gas particles in orange, liquid in grey, crystal in purple. Left: strong attration, thin network. Right: weaker attraction, stress-driven rearrangement is possible and thus crystallisation.
In our experiments we observed a very different scenario. The network formed, but strands were so thin (one or two particles thick) that we had a hard time calling it a liquid or a glass phase. In some conditions (weaker attraction) some strands snapped and the network could coarsen a bit more, maybe 4-5 particles thick. Here occurred the unexpected: crystallisation.
Because there was enough space available in the liquid network, the particles in the network were able to rearrange locally to form crystal nuclei. Instead of a disordered glass we obtained a network full of ordered crystals.
Growth of the crystals beyond the original liquid network
At some point, a crystal reached the edge of the liquid network. And it did not stop there. Particles in the gas adsorbed on the crystal, allowing it to grow further than the envelope of the original network. But there are so few particles in the gas, they should be quickly spent? Not if other parts of the system sublimate or vaporize. What we found is that particles in the liquid network vaporized and then adsorb on crystals far away, making them grow.
Ice crystal grow at the expense of surrounding supercooled water droplets.
Interestingly, this sequence of events is very probably what is responsible for rain. Atmospheric clouds are made of water droplets. It is cold up there and the water is supercooled, liquid despite a temperature below freezing. Thermodynamics tells us that water vapor in contact with supercooled liquid water has to be at higher pressure than water vapor in contact with ice at the same temperature. Actually when one droplet eventually freezes we obtain an ice crystal in contact with vapor which pressure is too high because set by the surrounding supercooled water droplets. So the gas condenses on the crystal, and the crystal grows at the expense of surrounding droplets that need to evaporate to maintain the vapor pressure. The crystal sucks the water out of the droplets without touching them. At some point the crystal becomes large enough to fall out of the cloud. Tens of meters below the temperature is hot enough to melt the crystal into a rain drop. This is called the Bergeron process. Next time you open your umbrella, think about this complicated sequence of events involving three phases - crystal, liquid and vapor.
Of course, if the temperature is below freezing down to the floor we get snow. The delicate geometric shapes of snowflakes are made possible by their formation process. Vapor adsorption on crystals allows a much slower and more harmonious growth than direct liquid condensation. Crystalline planes are more ordered, cleanly arranged. That is what we observed in our crystal-gels.
So, to sum up, we have observed an other way to arrest a phase separation into a gel that involves crystallisation rather than glass transition. This process creates a crystalline network with a large area of neat, vapor-deposited crystalline planes. It screams “catalysis” to my ear, or any kind of application that needs a large area of crystalline materials. And we demonstrated that such porous materials could be made in one pot, with the system tumbling down all the different steps by itself: phase separation, stress-driven rearrangements, crystal nucleation, vapor deposition. I hope people designing “real materials” (not made with fancy colloids) will be able to make such crystal-gels with nice applications down the line.
I had the pleasure to learn that my research proposal to the French national research agency (ANR) will be funded. I'll have 4 years to look into the microscopic mechanisms of gel fracture.
It means I'll be recruiting a PhD student from October 2018. If you are interested, let me know.
Our graphical abstract for the "polymer in procession" paper has been selected by TOC ROFl, a Tumblr that collects "funny table-of-contents images from scientific journal articles."
Almost three years ago I became involved in an interdisciplinary project between physicists and chemists. The chemists were specialists in organic chemistry, that is to say, make complicated molecules mostly based on carbon. The physicists were specialists of the mechanics of soft materials, that is to say, how matter in between fluid and solid deform, break or flow.
Making these two groups of people work together was very difficult. Interdisciplinary science is hard. Scientists spend years or decades to understand enough a narrow field of knowledge to be able to make it progress. So when you put together scientists of different fields, they do not have the same vocabulary, the same methods, the same questions or the same expectations. When among physicists we were saying "We impose a constant shear stress" as a matter of fact, chemists were seeing us as
Physicist as seen by chemists
but we only meant "we apply a sideways constant force on the sample". And of course when chemists were telling us "This counter-ion is more chaotropic" we thought they were doing something like this:
Chemist as seen by physicists
To understand what the chemists meant I had to remember my chemistry classes like 15 years ago. Fortunately I quite liked chemistry in undergrads. I even defined myself as a chemical physicist, a much needed missing transmission belt. I was able to play the role of translator between the two groups. What the chemists meant was that the ion was disturbing a lot the water around itself.
At the end, we were able to work together. We made mechanical experiments on samples that were about a millimetre thick and we understood the results at the level of atoms. Conversely, we used this chemical understanding to design the mechanical properties of our samples. Let me explain to you what we did, in terms that both my physicist and chemist colleagues are able to understand.
All started with a new synthesis method used by the chemists. Polymers are long molecules where the same unit is repeated many times, a bit like a caterpillar. To make polymers the chemists started from a head and added about 70 body segments one by one. Then they added the chemical groups they wanted to each unit, like if they added legs to every body segment.
Here they managed to have a head with two negative charges and each body segments with one positive charge. In water the polymer schematically looks like that:
A polymer were most of the counterions are far away.
The minus charges floating around are counter ions. They are here to ensure that matter has a neutral charge in average. Some counter ions are floating far from the polymer, other are very close to the body segment they neutralise. We say that they are "condensed" on the polymer. The more condensed counter ions, the less the polymer looks charged from far away.
If you put that short linear polymer in pure water, it forms a very soft gel. Interestingly, you can inject it with a syringe. The gel is solid at rest, flows through the needle, and is solid again on the other side. Quite nice if you want to use a gel as a scaffold for cell growth in vivo. Nowadays, the gel is a soft solid that breaks irreversibly. You need a surgical procedure to put it in the body. With our type of gel a needle is enough.
Unfortunately for the applications, we found that our gel was very easily disturbed. If instead of pure water we used salty water the gel collapsed. If we started from a neutral head instead of the head bearing two minuses, no gel could form. Our mechanical measurements found no difference between the polymer solution and water alone. So we thought that the gel was formed due to charge interactions: minus head sticking to plus body. If no minus on the head, no gel. If salts, themselves charged, get in the way of the electrostatic attraction, no gel.
Also, something was quite strange: the gel was too soft. Like a thousand times too soft for such short polymers. A polymer gel is a 3D network whose edges are polymer chains and whose nodes are where chains meet, also called cross-links. The more meeting points you have, the harder the gel is. In other words, if you have short chains between cross-links, few body segments, the gel is hard. We measured the elasticity of the gel, and it was so soft that we predicted something like 60 000 body segments between meeting points! That is enough to make 880 of our short polymers!
As the caterpillars on the picture above, our short polymers go on a single file.
So, we physicists were like "wow! that's strange" while the chemists were not caring much. Actually, the chemists were playing with their synthesis method to change the legs of the caterpillar.
Two ways to change the legs of the caterpillars: shape of leg correspond to the nature of the cation, either Immidazolium (aromatic cycle) or Pyrrolidinum (all single bonds). The colour corresponds to the counterion: F-, Cl-, Br- or I-.
For some compositions, the polymer was basically insoluble. No way to make a gel with it. To understand that, we have to remember that polymers are usually not very happy in water. What allows them to dissolve is their charges. If a polymer carries a lot of same charges (here pluses) these charges will repel each other, the polymer will stretch and will accept a lot of contact with water. If a polymer carries little charges, it will just collapse on itself to minimize the contact with water. You may remember from above that the more counter ions are condensed, the less charges the polymer carry, the less soluble it is.
A polymer with complete counterion condensation. Probably insoluble.
And indeed, we observed insolubility for the three compositions where the interaction between the repeated cation and its counterion was the strongest.
On the opposite, when the repeated cation and its counterion interacted weakly, we observed very strong gels, indicating shorter processions. Actually for two compositions we observed gels exactly 880 times stronger than the original one, meaning that the processions were just a single chain long.
So far so good, but all of this was learned by probing gently the softness of the gels, at deformations so low that they were not flowing but behaving as solids. To understand what is going on at larger strains, we have to have a look at the internal structure of a procession.
The procession at different scales.
As we said before, the monomers hates being in contact with water, so their preferred shape for the procession is a sphere. However plus charges prefer to be as far away as possible, so their preferred shape for the procession is a rod. It append that water-hating monomers are stronger on the small scales and that estranged charges are stronger on the large scales. So there is a scale D were the two influences balance. If the procession is just long enough to coil into a sphere of diameter D, then charges do not complain too much. But if the procession is longer, the charges refuse to make a larger sphere, and instead the procession grows into a cylinder of diameter D.
This cylinder does no grow in a straight line indefinitely. On scales large enough, counterions screen the charges from each other and the procession winds its way away.
Two charges in the mood for fight screened from each other by counterions.
So when we pushed harder on the gel to make them flow we found two threshold deformations. The first threshold corresponds to when the large scale winding path of the processions becomes extended. On small scales the procession is still collapsed to avoid contact with water. To stretch it further more monomers has to come in contact with water, it cost much more energy and this is visible on the mechanical measurements. The second threshold corresponds to the breaking of head to body bonds and it's when the gel flows.
Each circle is a blob of momomers collapsed to avoid contact with water.
For all compositions, the first threshold deformation is very small, telling us that the processions are almost linear at rest. It implies that the amount of charge condensation is directly related to the softness of the gel. So we are able to estimate charge condensation that varies from 10 free counterions per polymers (lots of charges) to one free counterion every 9 polymers in the procession (very few charges).
By contrast the second threshold vary widely between compositions between 10% and 800%. Some gels flow immediately, others need to be stretched height time their initial size before flowing. This indicates that the head to body bonds are incredibly strong. Usually in water ionic bonds are about 100 times weaker that chemical (covalent) bonds. For our lowest charge polymer we measure head to body bonds that are within 20% of the carbon-carbon bond!
Our explanation is that with few charges the procession collapse around the head-to-body bond to avoid water. So the environment just around the bond is not water, it's hydrophobic polymer. Such environment is like an oil, where charges are few but interact very strongly. Indeed in oils other people have measured ionic bonds that strong. Actually this strategy is used by life itself: proteins can have just one charge in the middle of a large hydrophobic patch. When two such proteins with opposite charges meet the two hydrophobic patched stick together, expelling water from the direct environment of the charged and the ionic bond become very strong. This forms a lock and key mechanism that helps for example our immune system to recognise and block pathogens.
Time to wrap up, thanks for reading down to here. At the end, we have done very standard mechanical measurements at the millimetre scale to extract informations at the chemical level. Our model tells us what to change to tune the mechanical properties of our gel by a factor thousand. Thanks to a referee, we also did a back of the envelope calculation to see what these gels would give in a physiological environment, and we have a good candidate to inject in a living body. If anybody is interested on the biology side...
Reference:
Srour H, et al. Ion pairing controls rheological properties of “processionary” polyelectrolyte hydrogels. Soft Matter. 2016. ArXiv 1611.07721.
The soil we stand on is like a mille crepe, a layered cake made by the slow deposition of solid matter on an ocean bottom, each era adding a layer of a different nature. The process that makes particles even slightly denser than water settle down is called sedimentation.
A particle is pulled down by gravity, slowed down by the viscosity of the solvent. It also gets kicked randomly by the atoms around. For a large and heavy particle like a canon ball this random motion is negligible and the particle sediment to the bottom. For a small and almost buoyant particle like a protein, this random motion dominates and the particle diffuses in any direction. In between we have the so called sedimentation-diffusion equilibrium. Particles settle down, but also diffuse up, and we observe that the concentration of particles changes depending on height. At the bottom we count more particles than at the top. This is what we call a density profile.
Equilibrium density profiles are a great tool for physicist. By measuring them, you can learn how your particles behave as a system. For example, if you observe a density that decreases exponentially with altitude, you known that the suspension behaves like an "ideal gas", which means that the particles almost do not interact. That's more or less the density profile of the gases in the atmosphere.
If you observe a sudden jump in a density profile, it means that you have an interface between two phases. For example between a gas of particles and a liquid of particles.
A colloidal gas-liquid interface. Picture by Paddy Royall.
If your particles are all the same size, you can even observe two consecutive jumps, from gas to liquid and then from liquid to crystal, where the particles are neatly aligned. Particles with different sizes would jumble the alignment. In general, it is quite difficult to make particles of different size crystallize.
There are several ways to get to this triple coexistence situation. One possibility is that you first have the gas and the liquid that separate, and then the crystal forms from the liquid. A second possibility is crystals condensing from the liquid, settling down in sufficient quantities and only then does the liquid evaporates to form a gas layer on top. A third possibility is the crystals forming at the same time as gas bubbles, racing to the bottom or the top respectively. Only when gas and crystal layers sit on top of each other does some of the crystal melts to form a liquid layer in between.
My contribution was to add some more complexity to the first scenario. What if I add a few large particles (green) in the suspension of small particles (red) ?
At first, nothing changes: on top a gas that has almost no particle and on the bottom a mixture of many small and a few large particles. If there was only small particles crystals would form at the bottom. But the large particles get in the way and no crystallisation occurs at the bottom.
Meanwhile the large particles settle faster than the small ones. So at the top of the liquid we soon have a layer devoid of large particles. Only small particles? Easy to make crystals then (big red blobs on the video below). Crystals are large, compact, and fall even faster than large particles. They outpace them and dive in the dense mixture of large and small particles. Splash!
And here we have something unexpected: the crystals float! I mean, yes, ice floats over water, we are accustomed to this. But water is an exception. Solid metal sink down into molten metal.
Actually we demonstrates that the mixture of small and large particles can get so dense without crystallizing that crystals made only of small particles can float in it.
The crystals are reasonably happy in there, not melting but not growing either. Since crystals are dropped continuously from the top, they end up filling pretty much the whole pool (where the large particles are) and even piling up over the level of the large particles.
Now the crystals that are over the level of the pool have no large particles to prevent their growth, so they grow and make a dense "ice pack" on top of the pool.
Final state of the limit between floating crystals (below) and the ice pack (above). This is the same place as the video above.
At the end, you get a pretty layered cake: gas on top, then a layer of liquid, then the ice pack, then the crystals made of small particles floating in the pool of large and small particles.
Details of the full layered sediment. Top: gas-liquid interface. Middle: ice pack. Bottom: crystals made of small particles in a small+large amorphous matrix.
Leocmach, M., Royall, C. P., & Tanaka, H. (2010). Novel zone formation due to interplay between sedimentation and phase ordering. EPL (Europhysics Letters), 89(3), 38006. doi:10.1209/0295-5075/89/38006 http://arxiv.org/abs/1402.0315
I am using IPython a lot, either as a command prompt or in a Jupyter notebook. This is great to analyse data on the go. During such analysis you may generate some files, either some intermediate data, or figures.
Sometimes, weeks, months or years later you would like to remember exactly what you did to generate this file. This is important for science reproducibility, to check you followed the right method or just to reuse this handy bit of code.
When you have copied the code in a script file, easy. When you have organised properly your notebook and never delete the interesting cell, piece of cake. When it was yesterday and you can press the up key N times to look for the right set of lines in the history, painful but doable. But this no warranty, no rigorous method. One day you will think that writing the script is useless, one day you will delete the wrong cell in your notebook, and months after you will have to come back to this analysis and the history will be gone.
It is really akin to the lab notebook, the one in which you note the date, the temperature, the sample name, the procedure you follow, the result of the measures and all the qualitative observations. Some of it seems to matter much at the moment, but if you forget to write it down, you will never be able to reproduce your experiment.
How to make IPython generate this virtual notebook for you?
You want a file per IPython session with all the commands you type. You can achieve this manually by typing at the begining of each session
%logstart mylogfile append
But of course, you will forget.
We have to make this automatic. This is made possible by the profile configuration of IPython. If you have never created a profile for IPython, type in a terminal
ipython profile create
This will generate a default profile in HOME/.ipython/profile_default
Edit the file HOME/.ipython/profile_default/ipython_config.py and look for the line #c.InteractiveShell.logappend = ''
Instead, write the following lines
import os
from time import strftime
ldir = os.path.join(os.path.expanduser("~"),'.ipython')
filename = os.path.join(ldir, strftime('%Y-%m-%d_%H-%M')+".py")
notnew = os.path.exists(filename)
with open(filename,'a') as file_handle:
if notnew:
file_handle.write("# =================================")
else:
file_handle.write("#!/usr/bin/env python \n# %s.py \n"
"# IPython automatic logging file" %
strftime('%Y-%m-%d'))
file_handle.write("# %s \n# =================================" %
strftime('%H:%M'))
# Start logging to the given file in append mode. Use `logfile` to specify a log
# file to **overwrite** logs to.
c.InteractiveShell.logappend = filename
And here you are, each time you open a IPython session, either console or notebook, a file is created in HOME/.ipython. The name of this file contains the date and time of the opening of the session (format YYYY-MM-DD_hh-mm). Everything you type during this session will be written automatically in this file.
The good news first: our paper on wrinkling yoghurt was accepted. I won't tell you where since it is under embargo. If you want to know what it means to have a paper accepted, and what sort of work in involved (disclaimer: comparable to the amount of work need for the research in itself), have a look at this:
But last Friday night, 11pm, we received a mail from the editorial office saying something like
Our typesetting department must have Word document files of your paper [...].
Please provide these files as Word documents as quickly as possible and within the next 8 hours to keep your paper on schedule for publication.
Well, except for the short notice and the looming weekend, there was a big problem. Our paper was not a Word file and the conversion is all but easy. Let me explain
Academic paper formatting
But there is another last step not described here: formatting. Of course, you can open any text editor (notepad, your webmail) and type words after words to write the text of your article. But then, you would miss:
figures
equations
cross-references
Figures are the graphs, the pictures and the drawings. You can insert them if you switch to any modern word processor, LibreOffice or Microsoft Word for example. Getting them beautiful and right is a work in itself.
Equations are a nightmare with Word. Just writing y≈αx7 makes you seek in 3-4 different menus. But you can do it. Markup languages, like the HTML of this page, makes it easier once you know the syntax. LaTeX is a markup language made for equations. The above equation just writes $y=\alpha x^7$. LaTeX syntax for equations has become a de facto standard, so other languages likes Markup, offer to write the math parts in LaTeX. Plugins in LibreOffice also do that.
Cross referencing means that in your text you can write "see Figure 3", then switch figures 3 and 4 and have "see Figure 4" written automatically in your text. In practice you do not write the figure number, but insert a reference that the program will convert into the figure number. You can do that with Word through one menu and a rather unhelpful dialogue box. In LaTeX it is just "Figure \ref{fig:velocitygraph}". Actually, in the final document, you can even get an hyperlink to the figure. Same with chapters, sections, equations.
What is great with LaTeX is that your bibliography can be generated the same way. You just insert "was discovered recently \cite{Leocmach2015}" and the paper Leocmach2015 gets inserted in your bibliography, formatted properly and consistently. In the final document you would get "was discovered recently [17]" with an hyperlink going to the 17th item in your bibliography. Of course, you have ways to do that with plugins in Word or LibreOffice.
LaTeX is also nice because you can specify what you mean and then let the program format it for you. For example, when I want to write "10 µm" what I mean is ten micro metre, not "one zero space greek letter mu m", so in LaTeX I write "\SI{10}{\micro\metre}" and it will generate a "10", followed by an unbreakable space (you don't want the number and the unit on different lines or pages), followed by a micro sign µ (different from the μ in some fonts) and a "m".
By the way, LaTeX is open source and free, no need for a licence. The "final document" is a PDF that anybody can read. Actually, until Friday night Editors and Referees of our paper had only seen and judged the PDF. Nobody was caring about formatting (even if it helps to have a clean looking paper to show rather than a messy Word file).
So LaTeX is made for academic paper writing, and heavily used in Math, Physics and other communities. It would be unthinkable that a journal specialised in Physics refuse LaTeX formatted paper. However for Biology, Word is the norm. It must be a pain for the typesetting departments who have to translate Word format into something more usable. Broad audience journals often accept both, but not the journal we submitted to.
Latex to Word conversion
I spent most of my Saturday thinking about a reliable and reusable way to convert my paper. This won't be the last time I am asked to provide a Word file. I received advices on Twitter, tried various solutions, all unsatisfactory, and at the end I settled to this method:
Dumb down the LaTeX layout. I was using a two column layout with figures within the text, I switched to a single column layout with a figure per page at the end of the document.
Add \usepackage{times} to your LaTeX preamble in order to use Word default font Times New Roman.
Let LaTeX make the PDF. All the commands, custom packages, etc. are taken into account. Cross references and bibliography are also right.
Convert PDF into Word. @fxcouder did it for me using Adobe. There are probably open source ways of doing it. Simple equations were preserved, but as soon as fractions were involved the format was messy.
Clean the Word file. No messing up, you need a real Microsoft Word with a licence. Work in 97/2000 compatibility mode. You need to show formatting marks, track down and delete the section breaks to obtain a single flow of text. Fix also the line breaks and hyphenations for the paragraphs to be in one piece. All messy equations must be cleaned up, leaving only the numbering for the numbered ones.
Re type the equations. I did this by hand in Word since I had few equations to retype.
Copy the whole text and paste in into the template provided by the editor.
Rather than retyping the equations, an other way would be to process the original tex document into an ODT (LibreOffice) document using pandoc.
pandoc -s article.tex -o article.odt
Pandoc is messing cross-references, citations and anything custom in your LaTeX code. Do not use it for the conversion of the main text. However it gets the equations right. Then from LibreOffice, you can export the equations and import them back into the Word document.
So, why worry? It takes you only half a day for a 15 pages paper instead of the 8 hours requested by the editorial office.