Saturday, March 17, 2012

Count on your neighbour

Counting how many stuff you have is important
Scrooge counting his money
... but boring
counting sheeps
During last week, I saw a few times one of my fellow lab member printing a picture like this
Phase contrast microscopy picture of nucleation
and putting a cross on each white object. He was counting them. The first time I saw this, I thought he had to do it for one or two pictures. But at the end of the week, I asked him what he was doing and if I could help.


The above picture is taken when a phase A nucleates into a phase B. This appends for example if you cool a liquid below it's crystallization temperature. A crystal nucleus will appear from time to time and grow. The probability to form a nucleus (nucleation rate) is a very important physical parameter: if nucleation is extremely rare, you will have a single nucleus in you bottle that will grow to form a single crystal before the birth of the next nucleus. This is exactly what you want for example when you make a silicon wafer for microelectronics. If nucleation rate is high, then you will have many nuclei growing at the same time and at the end a material that is made of many different crystals. You may want this in ice creams, because small crystals have a more pleasant texture than big ones.


The only method to measure the nucleation rate in a given system is to count the number of nuclei function of time. So my colleague was counting ... for the whole week. He had done two dozens of experiments at different temperatures and compositions, and took a series of picture for each (like every couple of second for a few minutes). This makes hundreds if not thousands of pictures to analyze. And his plan was to do it by hand.

Try to count how many nuclei are in the above picture. This is a task that need careful attention: large nuclei have a good contrast, but there are many smaller ones very difficult to tell from the background. That's why my colleague was printing and crossing the counted nuclei.

As I told you in a previous post, this kind of procedure can be fully automatized. The programming takes time, so if you have only a few pictures to analyze, this may not be a good idea. In addition, this counting is tricky because the objects can have very different sizes and contrasts. However I, sitting 3 steps away, had already developed and tested such a program. The physical signification is different (I am tracking polydisperse colloidal particles) but the technology is the same. So yes, I could help.

An hour later my colleague had in his computer a script counting the nuclei for him, a picture per second or less, automated to treat a whole time series automatically without human intervention. Setting-up Python and dependencies on his computer took half of the time. We should have communicated earlier, before he had spent a week doing what the script could do in an hour.

Result of the localization. Original image (red) superimposed with localized positions (cyan squares)
As you can see on the picture above, the result is not 100% perfect, but quite close. For example there are problems when nuclei are fusing and there are also (very few) centers counted multiple times. I think I know how to adapt better my program to this situation, but my colleague told me it was enough precision for him.

This gives an other motivation to explain (in a future post) how this counting/localizing method is working.

Tuesday, January 3, 2012

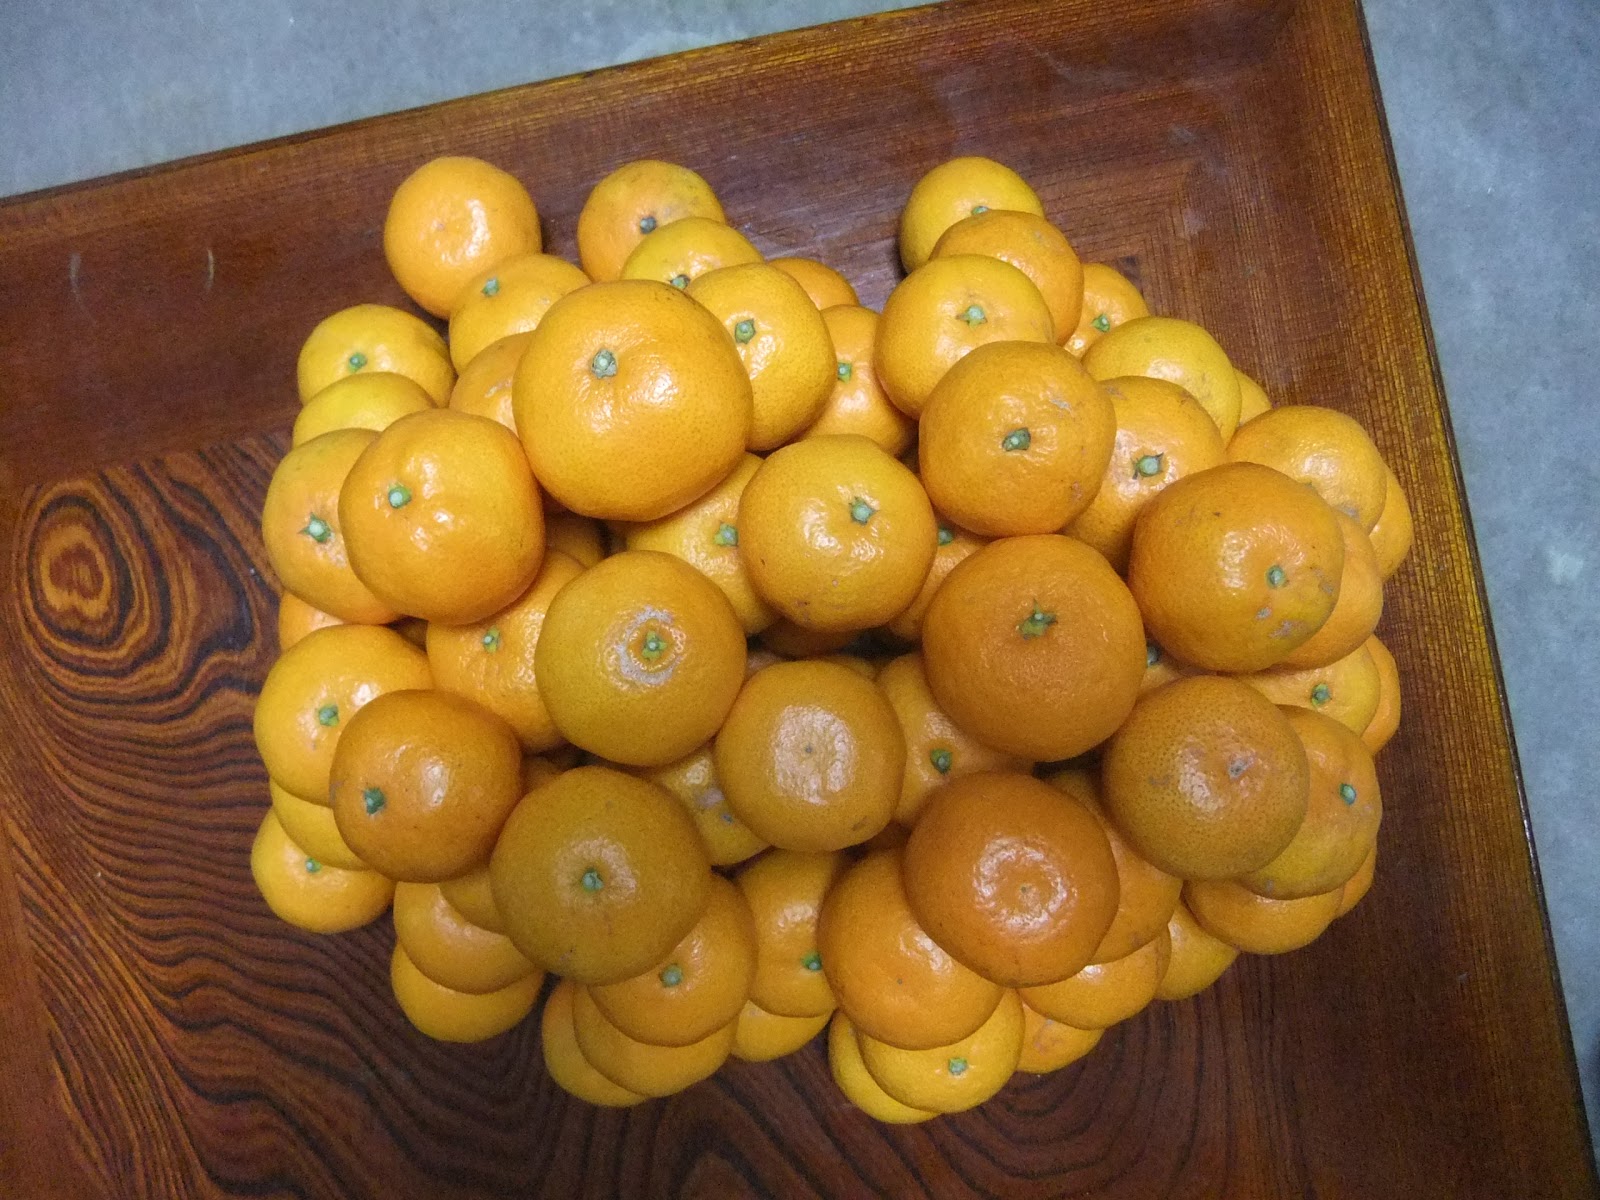
Mikan stacking fault

Never leave a crystallographer with a pile of fruits.

HCP(left)-FCC(right) stacking fault
Even if I do not consider myself a crystallographer, I spent most of my PhD identifying local symmetries in materials. And the pioneers of the land of symmetries in materials are the crystallographers, so I owe them most of my analysis tools ... and the tetris-o-philia.

The FCC side, note how the 3rd layer's fruits sit on top of voids in the first layer
During new year's vacation in my family in law, my daughter (in the background of the upper picture) started emptying the reserve of mandarin to bring them on the living room's table. This got me started at piling the fruits.
The HCP side. 1st layer and 3rd layers sit on top of each other
The pile begins by a layer where the fruits form hexagons. This is the most compact way of packing disks of the same size in 2D, and thus spheres of the same size on the same plane. Real fruits have different sizes, but anyway.

For the second plane, you have two possibilities that are mirror image of each other, a translation, a rotation of 30 degree, etc. In short, this is not a real choice because you have no reference point.

The same alternative has richer consequences in the third plane. Depending on your choice, you end whether with
  • 3rd layer's fruits sitting on top of 1st layer's fruits
  • 3rd layer's fruits sitting on top of 1st layer's voids
Because you have the first layer as a reference, the choice is no more silent. You end with two different crystals: Hexagonal compact (HCP) and Face-centered cubic (FCC).

FCC is left, HCP right, and the grain boundary in the middle (hole in the 3rd layer)
Now let's be messy. I made two different choices of 3rd layer in two different places. The line where the two stacking meet is a stacking fault. It is not possible to pack same-size spheres efficiently on this line. Evidence is the hole you can see on the pictures.
FCC is right, HCP left, and the grain boundary in the middle (hole in the 3rd layer)
Finally, I added a fourth layer, with fruits sitting on top of the ones of the 2nd layer. No fault in this fourth layer, I can continue my stack if I want. However the fruits immediately over the fault line have a little more space to rattle. The same holds for the fruits immediately below (2nd layer).

If you think about the stacking of a crystal of hard spheres, the price paid to have such a stacking fault is the spheres you could not fit in because of the line. In my very small crystal, I could have fit 2 more spheres without the fault. This is a global penalty.

On the other hand, the space gained to rattle by the spheres neighbouring the fault line increases their (vibrational) entropy and thus decreases their free energy. This is a local gain.

When you balance the global penalty with the local gain, you end up with quite a lot of stacking lines.

Saturday, December 17, 2011

Unifiying conference

I am frustrated when I cannot go to an international conference once a year. But at the end of it I am worn out. Usually it lasts a week. This time it was two weeks in a row. I wonder how I am still able to think.

International scientific conference are at the heart of the research world, at least as important as scientific publications. Without conferences, you would not know who is working in your field. That is where you discover that paper authors are not only names but human beings. Dr. X who is contradicting your results is actually a very friendly guy an the best person to chat to or to go to restaurant with. Pr. Y whose intuitions are always stunningly genial can be a frightening freak, a reckless egocentric or ... a very seducing man/woman.

There are the personalities you discover and the ones you are eager to meet again. From conferences to conferences the bonds tighten (often despite the scientific disagreements) and from these irregular contacts emerges a community, a human community closely related to the abstract "scientific community".

But scientific conferences are not only a bunch of old chaps meeting once a year. This is a powerful way to exchange ideas and to be able to dig into what other researchers have discovered. If you have read someone's paper, you are able to ask him/her questions to clarify and discuss his/her work. If not, hearing his/her presentation may make you read the referring article.

In practice, a conference consists in a series of oral presentations of various lengths. Typically a researcher invited by the organisers will have an hour to expose his/her research in front of everybody, a researcher selected by the organisers will have 30 minutes, and the others will have only a poster presentation. I am at the poster level, so I stuff my results on a A0 that I hang in the dedicated place off the conference hall and during the so called "poster session" time I stand by, ready to explain my work to anybody interested. This also implies some advertising skill beforehand.
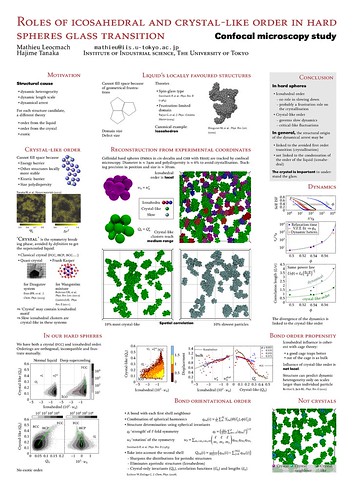
My poster for Unifying Concepts in Glass Physics 2011
Except your short time under the spotlight (your talk or your poster session), the conference consists mainly in listening to other's stories. In the past week I have listen to 8-10 talks every day, each representing at least months and more probably years of work condensed in 30 minutes or an hour. The previous week was more like 6 talks a day. Anyway, this is an enormous amount of information, a all you can eat buffet that I will slowly digest from now on.

I will probably post here in the future some reflexions or discussions that result from this conference.

Sunday, November 27, 2011

Seminar and meetings in France

I'm giving a seminar in the Ecole Normale Supérieure (ENS) in Lyon, France the 6th of December. Just after that I'll be in Paris for 2 consecutive meetings:
Both seminar and poster are about the same stuff I talked about in Kanto-softmatter workshop and in a previous post. Here is the more formal abstract.
A link between local structural ordering and slow dynamics has recently attracted much attention from the context of the origin of glassy slow dynamics [1, 2]. There have been a few candidates for such structural order [3, 4], icosahedral order, exotic amorphous order, and crystal-like order. Each type of order is linked to a different scenario of glass transition. Thus, revealing the order responsible for slow dynamics is crucial for our understanding of the glass transition. Here we experimentally access local structural order in polydisperse hard spheres by its particle-level observation with confocal microscopy. We identify the key structures as icosahedral and face-centred-cubic(fcc)-like order, excluding any other simple local symmetry. We find that both types of order are statistically associated with slow particles. However, when approaching the glass transition, the icosahedral order does not grow in size whereas crystal-like structures grow. It is the latter that governs the dynamics and is linked to dynamic heterogeneity. This questions the direct roles of the icosahedral ordering in glassy slow dynamics and stresses the importance of the structural order compatible with the avoided first order transition, crystallization. Our finding also suggests that the growing lengthscale of structural order is essential for the slowing down of dynamics and the nonlocal cooperativity in particle motion.

References

  1. Cavagna, A. Supercooled liquids for pedestrians. Physics Reports 476, 51124, 2009.
  2. Berthier, L. & Biroli, G. Theoretical perspective on the glass transition and amorphous materials. Rev. Mod. Phys. 83, 587, 2011.
  3. Steinhardt, P., Nelson, D. & Ronchetti, M. Bond-orientational order in liquids and glasses. Phys. Rev. B 28, 784805, 1983.
  4. Tarjus, G., Kivelson, S. A., Nussinov, Z. & Viot, P. The frustration-based approach of super-cooled liquids and the glass transition: a review and critical assessment. J. Phys.: Condens. Matter 17, R114R1182, 2005.
  5. Lubchenko, V. & Wolynes, P. Theory of structural glasses and supercooled liquids. Annu. Rev. Phys. Chem. 58, 235266, 2007.
  6. Tanaka, H., Kawasaki, T., Shintani, H. & Watanabe, K. Critical-like behaviour of glass-forming liquids. Nature materials 9, 324Ð31, 2010.
Reconstruction from confocal microscopy coordinates. Only structured particles are shown for clarity.

Wednesday, November 16, 2011

Particle tracking I : from analog to digital


Pinpointing the positions and sizes of tens of thousands particles from pictures. I can't miss one, I can't detect a particle where there is none. The precision must be extremely high. That is what I am doing routinely as the basis of my research. If I don't get this step right, my research has feet of clay, standing on sand.

In 1905 Einstein published three papers founding or revealing three different fields of physics : relativity, quantum mechanics and Brownian motion. The last one is a major breakthrough in statistical physics because if it was true, then matter was discontinuous, made of particles like atoms or molecules. However an experimental proof was needed.
Jean Baptiste Perrin

Jean Perrin exhibited this proof by the following experiments around 1908 : he suspended microscopic gamboge particles in water and waited for them to settle. Obviously their were more particles at the bottom than at the top ; however, how many more ? Perrin took a microscope and counted : how many particles do I see in average in a drop of suspension taken at 1 cm from the bottom (do it for 1000 drops to get a good average) ? How many at 2 cm ? etc. The concentration profile he got was perfectly fitting with theoretical predictions and thus discontinuity of matter was proved. Jean Perrin got the Nobel prize in physics 1926 for that.

A century later, how do you do track particles ? First, you don't need to stick your eye to a microscope. You take a digital picture with a CCD camera adapted to the microscope. Of course you can take movies.
A typical image of a dense colloidal suspension, taken by confocal microscope.
Now you have about ten thousand pictures like that out of a single experiment. Of course, you can superimpose the picture with a grid, locate the coordinates of a particle by following the grid with your finger, write them down in a notebook and so on and so forth. Perrin could have done that during years, but we have computer slaves.

Crocker and Grier designed the following algorithm to track individual particles from pictures. It is probably easier to understand if we imagine the intensity of each pixel as an altitude. For example, the two pictures below are equivalent.

Noisy picture of particles
Corresponding intensity profile
Blur your image to remove noise and to smooth the particles' intensity profile. Each particle should become a peak with no flatness at the top.

Previous picture, blurred


Find the pixels that are local intensity maxima. Their must be one per particle + others due to noise.
Local maxima


If you have large areas without particles, you may find local maxima there due to noise. If you remove the local maxima that are not bright enough, you should be left with only particles, none from noise. Now you know the coordinates of each particle centre with discreet (pixel) precision.
To increase the precision, you can take the centre of mass (intensity) of the pixels surrounding each possible centre. This gives subpixel resolution (about 1/10th of a pixel).

This is an extremely quick and efficient algorithm used routinely by many groups either in 2D or in 3D (yes, you can take 3D pictures, I'll have a post about it). You can check the official web page for more information. My own code for that is on sourceforge.

So far so good if your particles have the same size ... something that almost never append in nature, and not that often in experiments. I'll write about the more-than-one-size case in an other post.

Friday, November 11, 2011

Kanto softmatter talk

A busy week is ending ... almost. I give a talk tomorrow at a workshop (yes, a Saturday !), on Monday I submit a research proposal to be paid from April. And after that I will have to work again on a paper that has been rejected.

Tomorrow is the kanto softmatter workshop, a very local meeting for the soft matter labs around Tokyo. Talks are only given by young researchers, not by big names. That is why I have an opportunity to talk. In larger conferences until now I only got poster presentations. Well, there is no bed of roses.

I will talk about my thesis work, in particular the content of the paper that was rejected: what are the local structures playing a role in a model of glass transition and which one is more important than the other. The answer is rather surprising. A glass is amorphous, so most people think that a glass is the opposite of a crystal. Therefore if glass has a structure this structure must be very different and incompatible with the crystal symmetry. That's why icosahedral order is often exhibited as a typical glass order.

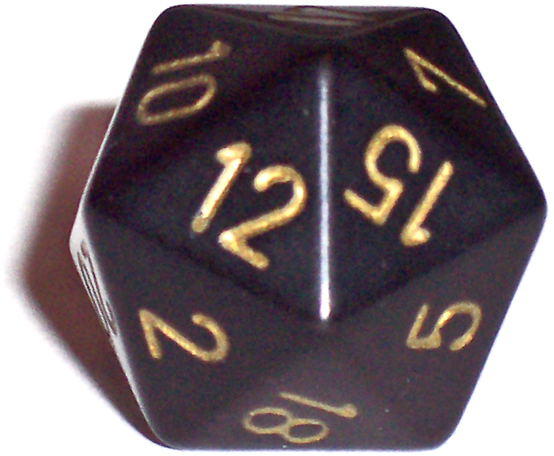
A icosahedron is a solid with 20 identical faces. Like this dice used in Dungeons&Dragons.
via Wikimedia
13 particles forming a perfect icosahedron, from my thesis
As you can see, there are pentagons everywhere in that structure: icosahedron has 5-fold symmetries. The problem with five-fold symmetry is that it cannot pave space (at least in 2D and 3D). Try to pack them together and you will always have gaps.
By JF Sadoc via Wikimedia

However, the icosahedron is very dense and often maximises locally the interaction energy between the particles. Icosahedral order is locally the best structure, so it forms easily in a dense liquid, but cannot spread. That is what is called frustration.

What one can image in a supercooled liquid is icosahedral bits, probably forming a sort of network or fractal, and total disorder in the gaps. The icosahedral structure is stable, so is moves very slowly and slows the overall dynamics. If we are still in the liquid a given icosahedral bit will eventually disappears while order is formed elsewhere, but in the glass even that rearrangement is forbidden, too costly in energy to append in a reasonable time, so everything is stuck. Here is an explanation of the glass transition.

Another explanation (advertise by my boss, so my judgement may be biased) is that a supercooled liquid is by definition metastable to the crystal, so the liquids "wants" to become a crystal. Things are getting in the way (like icosahedron for example) so the crystal is not formed. However, there are stuffs in the supercooled liquid that look like a little bit like crystals. Not very healthy crystal if you pass me the expression; hunchbacks, twisted legs, broken faces, no arms ... still if you look close enough the local structure is closer to the crystal than anything else.
a) displacements b) crystalline order and c) number of neighbours in a 2D shaken granular supercooled fluid. From Keiji Watanabe and Hajime Tanaka,
Physical Review Letters (2008).
Once you have a method to detect these crystal-like stuffs, which has been done in an handful of models, you discover that they are slower than the rest of the liquid and that their size is growing when you get closer to the glass transition. Paradoxically isn't it the crystal that is responsible for the slowing down to the glass ?

Who is slowing down the system ? The locally favoured structure of the fluid or the influence of the crystal ? To answer this question I used a system that has independently icosahedra and crystal-like structures. In a few systems, people have found very slow icosahedral structures and some of them exhibited it as the proof that liquid order was the culprit. However others remarked that the "crystal" in these systems actually contains some icosahedral motifs. For example if the "crystal" is in fact a quasicrystal with five-fold symmetry, you cannot tell if the icosahedra that you see in the supercooled liquid come from the locally favoured structure of the liquid or as crystal-like stuff.
A Frank-Kasper phase, which is a crystal containing icosahedra (large blue spheres). From the Trebin lab in the university of Stuttgart.
A quasicrystal with icosahedral symmetry, via Wikimedia


To avoid that confusion, my system has a well known crystal of face centered cubic structure, without a glimpse of icosahedron in it. In addition, icosahedral order is locally favoured. In that situation, no mistake possible, the slower structure wins.

And at the end, I found that the icosahedral bits play very little role in the slowing down, the crystal-like bits are doing all the slowing work. Of course Icosahedral order plays a role : it is frustrating the crystallisation, and that is thanks to that frustration that we are able to supercool the liquid in the first place. However, that is the influence of the crystal that governs the slowing down and thus the glass transition.

Details in the paper to come ... when accepted.

Tuesday, November 1, 2011

PhD pre-defence training

At the end of this week one of my fellow lab member will know if he is able to write his PhD thesis. In our university this is probably the most decisive step in the process of getting a PhD.

How you get a PhD varies tremendously between countries, universities within the same country and sometimes even between departments within the same university. For example, in the US it is not uncommon to spend between 7 and 10 years in graduate school before getting the PhD. In France the distinction between undergraduate and graduate is fuzzy, but the line between Master and PhD is not: you need at least 3 years of PhD, often a few months more in science and a few years more in humanities. Here in Japan and in science/engineering departments the rules is 2 years of Master and 3 years of PhD. The PhD defence season is also tightly constrained modulo 6 months, so actually almost everybody abides by this 2+3 years minimum.

The fellow I am writing about has a quite unusual curriculum. He took a job in the industry after graduating from his Master, got sick of it and came back to the academia at the same time I was starting my PhD (the 3 last years). He had personal problems on the way and extended his PhD to 4 years. According to the training I attended on Monday, he will surely get his PhD with honours.

Defending a thesis is a rather formal - some would say "outdated" - ceremonial. It also depends a lot on the country/university. I heard that in the university of Utrecht in the Netherlands the candidate and the jury are dressed in 16-17th century outfits, family is invited and you never fail at your defence, neither do you get nasty questions. If you fail, that's before.
A PhD candidate in Utrecht
In France the dress code is less formal, but the jury can push you quite hard the D day. One of my friends in Belgium had to re-write his thesis after an inconclusive defence and defend it again a few month later.

Here in Japan everything is made to avoid last moment failure, thanks to a pre-defence. It's not a training strictly speaking. You are in front of the same jury as for the real defence, but it is before you wrote a single line of your thesis. You pack up everything you did in the last 2 years and a half into a 1h talk. The jury knows nothing of your work beforehand except the title and probably a short abstract. You don't want to obfuscate their minds or they tend to sleep. You don't want to appear shallow or you won't be able to write your thesis now. So you need to be ready, trained and mentored.

This is the decisive step. After that, you do your best to write your thesis, probably patch a few missing experiments/simulations/analysis, re-do everything just in case, etc. This easily eats the remaining 2 or 3 month before handing out the thesis, but the essential part is done. If you don't blow up during theses weeks of intense pressure and self-discouragement (I nearly did, but I was save by my family), you are done. You won't fail the D day anyway.

This fellow is going through the fire on Friday. His rehearsal on Monday was excellent (there were a few minor details to fix, but nothing important). Good luck.